Amber23: pmemd.cuda performance information
A lot has been done to improve the Amber23 code, and its performance relative to Amber20 is
steady despite accumulating new features. Your results may vary, particularly depending on the
configuration or operating status of the machines where you have your GPUs. If you are running
a solitary GPU with good cooling, you can expect to get numbers up to or perhaps a little
better than the ones posted here. If you are running the code on a dense server operating at
capacity, you can expect the heating sensors to throttle back the power and the performance
will suffer a few percent. The code remains deterministic—a
given GPU model will produce the same results from the same input time and again.
This feature is critical for debugging and has
allowed us to validate consumer GeForce cards as suitable for use with AMBER. The precision
model is able to conserve energy over long timescales with tight parameters. Throughout the
main code and the Thermodynamic Integration extensions we have chosen equations and workflows
with good numerical conditioning suitable for the 32-bit floating point math that dominates
our calculations. Most production simulations will not conserve energy because the input
parameters aren't good enough, not because the precision model fails. But, as we say,
ntt >= 2!
A bit of history
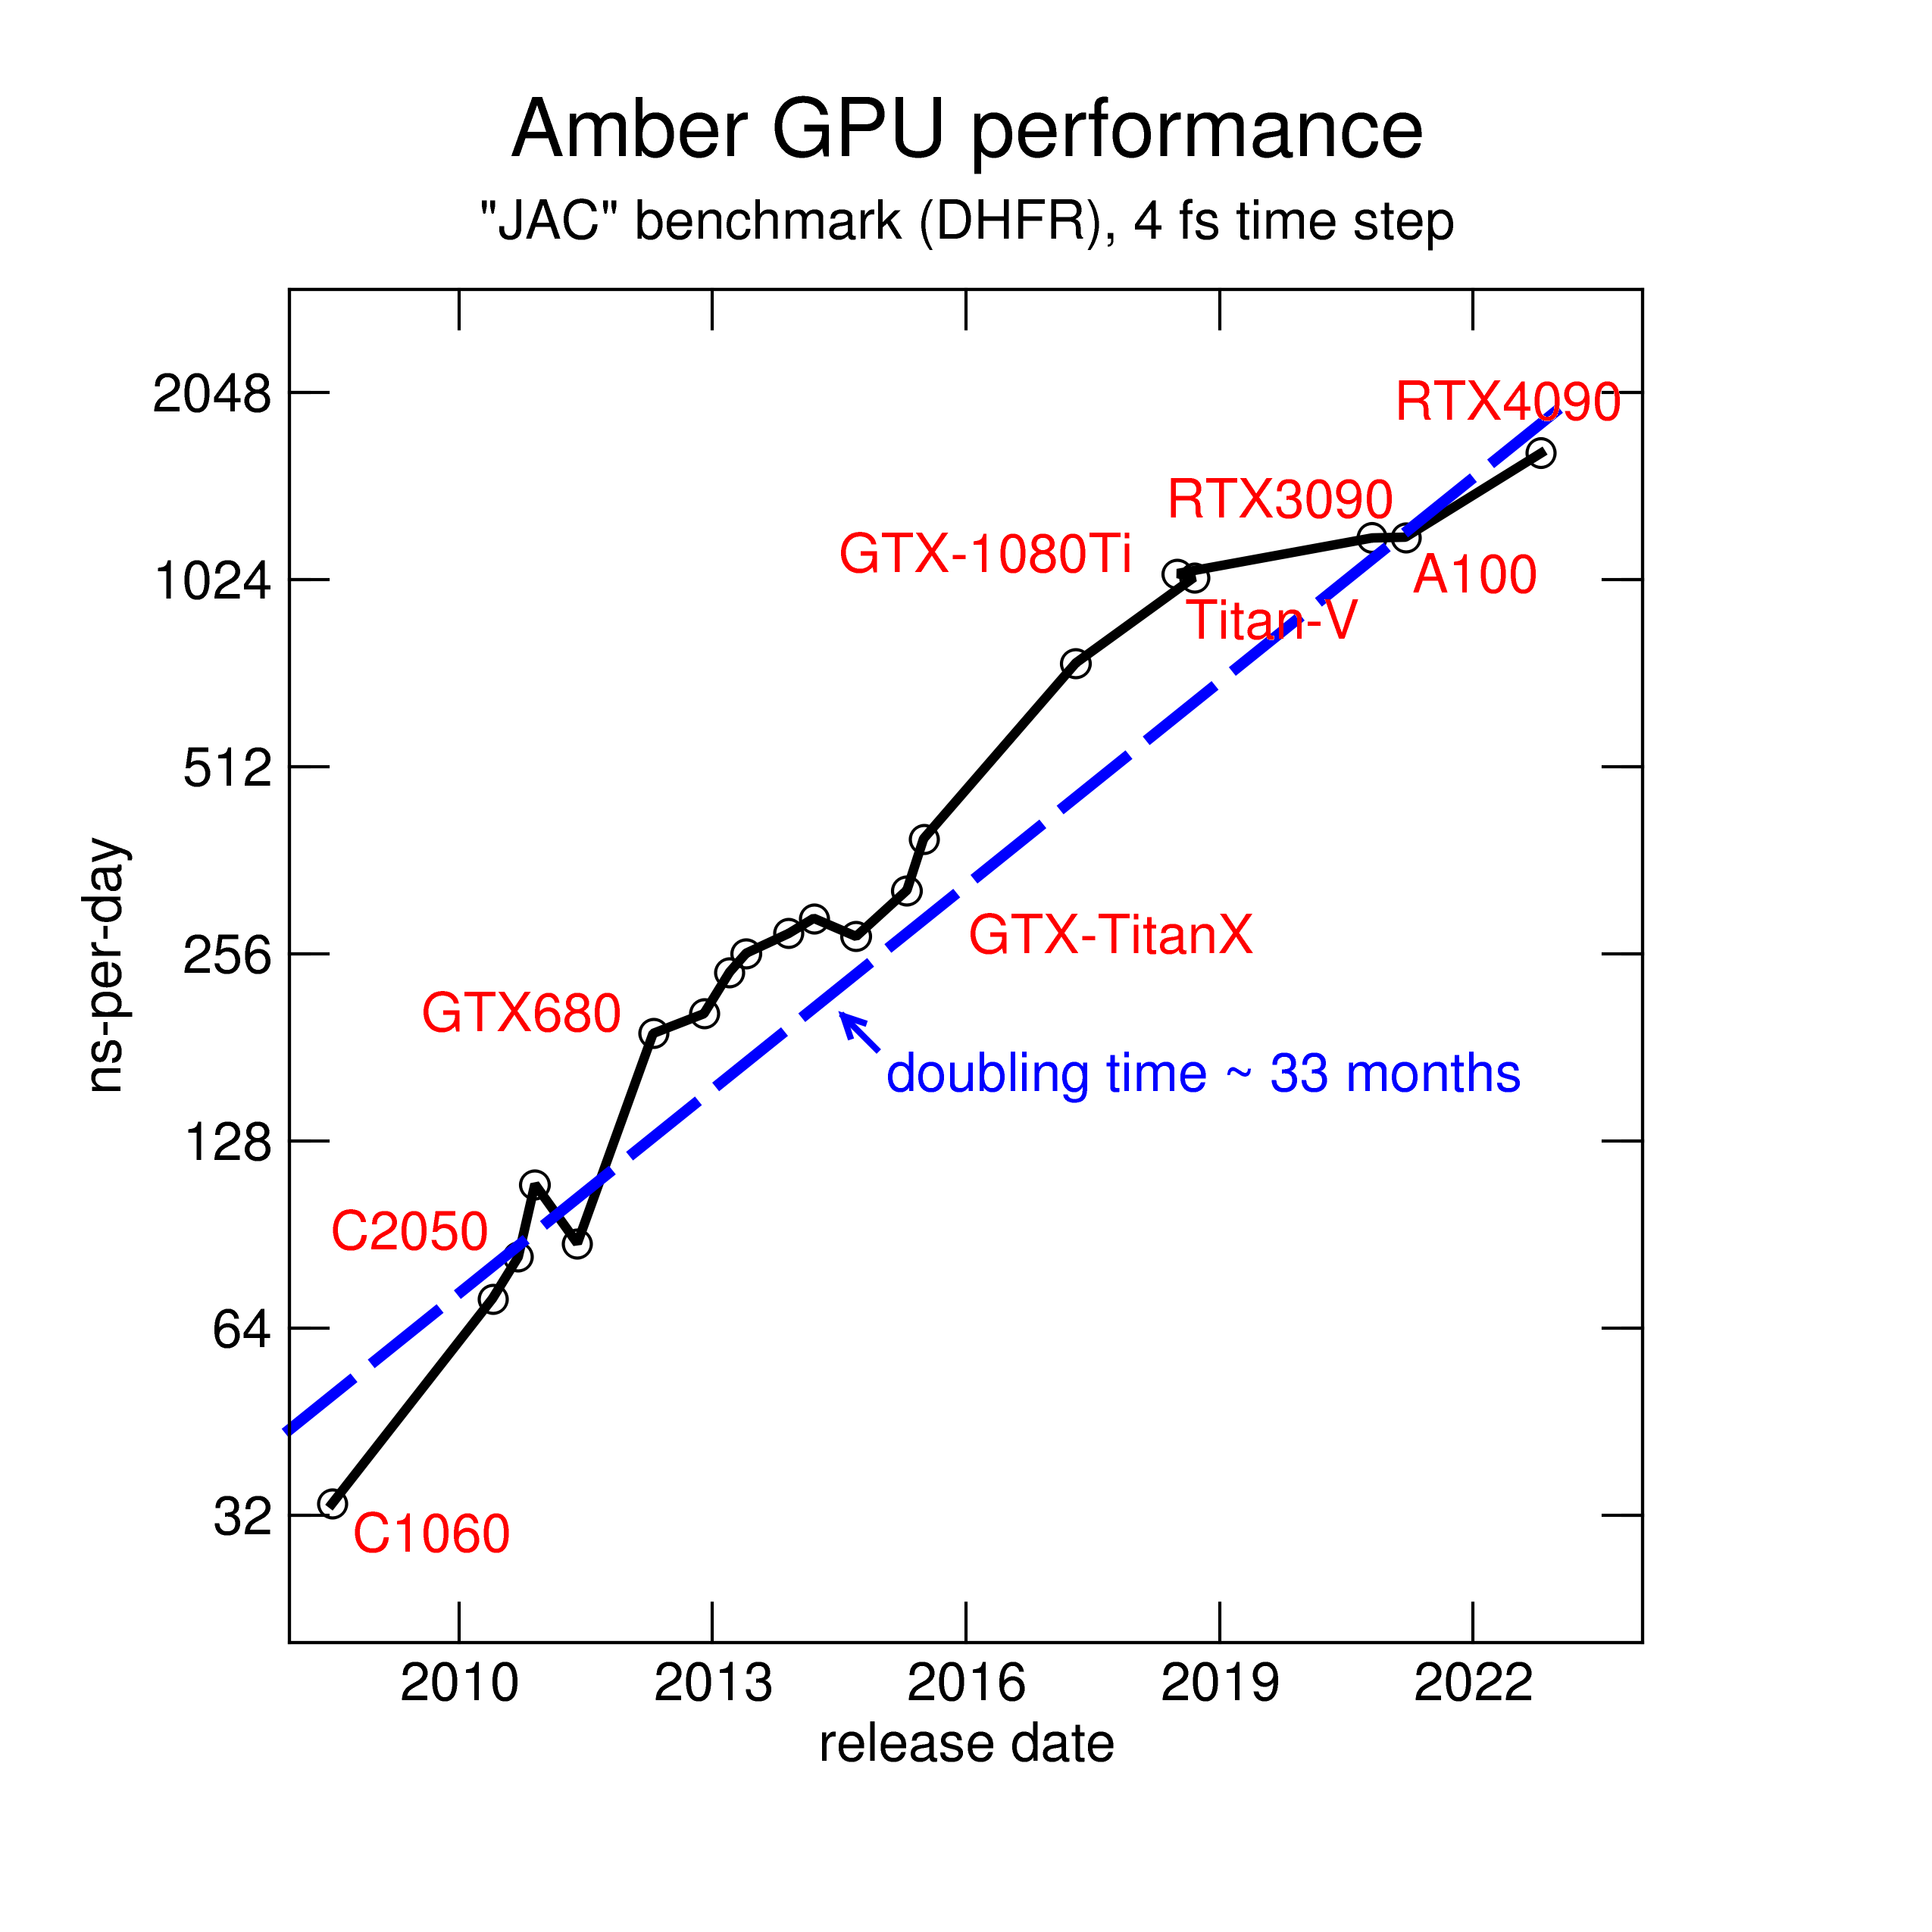
Amber developers have been working on GPUs for more than a decade.
Here is an overview of how performance has changed, due to both software
and hardware improvements, over than time span. We use a smallish
benchmark here, with 23,000 atoms.
We present here two complementary set of benchmarks, which we identify by the
names of their primary authors. The older set, created by Ross Walker, has been run on
nearly all versions of pmemd.cuda, and on many different GPUs dating to 2010. Users may be
accustomed to these, and results are available for previous versions. A more recent set of
benchmarks has been created by Dave Cerutti, which use settings more like those more common
in production today.
Recent Ada and Hopper benchmarks from Ross Walker
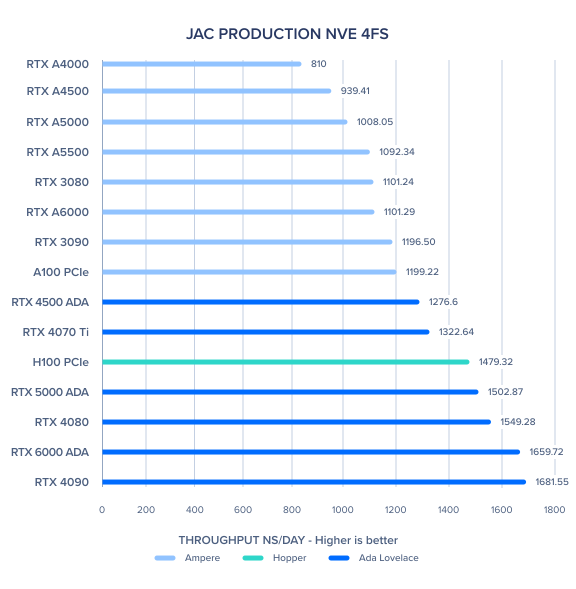
These numbers are from Ross Walker, December, 2023. The figure below gives a quick overview for the fairly small "JAC" benchmark. For complete results, click
here.
Recent Ampere benchmarks from Ross Walker
These numbers are from Ross Walker, February, 2023. See below for
details about what the individual benchmarks do.
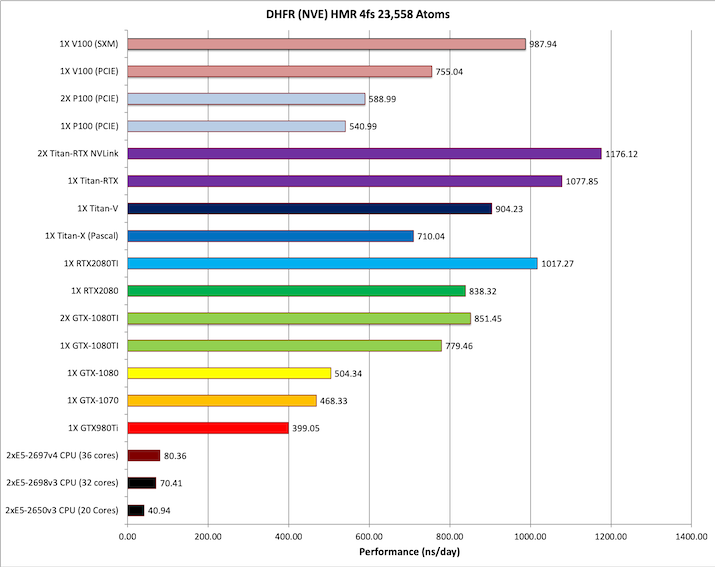
Following up on the 4090 and H100 numbers I now have benchmark numbers for
the 4070TI which are equally impressive and make it a good replacement for
the 3080 or even 3090.

JAC_PRODUCTION_NVE - 23,558 atoms PME 4fs
-----------------------------------------
1 x H100 GPU:      |         ns/day =    1479.32
1 x 4090 GPU:      |         ns/day =    1638.75
1 x 4070TI GPU:  |         ns/day =     1322.64
1 x 3090 GPU:      |         ns/day =    1196.50
1 x A100 GPU:      |         ns/day =    1199.22

JAC_PRODUCTION_NPT - 23,558 atoms PME 4fs
-----------------------------------------
1 x H100 GPU:      |         ns/day =    1424.90
1 x 4090 GPU:      |         ns/day =    1618.45
1 x 4070TI GPU:  |         ns/day =     1262.40
1 x 3090 GPU:      |         ns/day =    1157.76
1 x A100 GPU:      |         ns/day =    1194.50

JAC_PRODUCTION_NVE - 23,558 atoms PME 2fs
-----------------------------------------
1 x H100 GPU:      |         ns/day =     779.95
1 x 4090 GPU:      |         ns/day =     883.23
1 x 4070TI GPU:  |         ns/day =     701.09
1 x 3090 GPU:      |         ns/day =     632.19
1 x A100 GPU:      |         ns/day =     611.08

JAC_PRODUCTION_NPT - 23,558 atoms PME 2fs
-----------------------------------------
1 x H100 GPU:      |         ns/day =     741.10
1 x 4090 GPU:      |         ns/day =     842.69
1 x 4070TI GPU:  |         ns/day =     666.18
1 x 3090 GPU:      |         ns/day =     595.28
1 x A100 GPU:      |         ns/day =     610.09


FACTOR_IX_PRODUCTION_NVE - 90,906 atoms PME
-------------------------------------------
1 x H100 GPU:      |         ns/day =     389.18
1 x 4090 GPU:      |         ns/day =     466.44
1 x 4070TI GPU:  |         ns/day =     301.03
1 x 3090 GPU:      |         ns/day =     264.78
1 x A100 GPU:      |         ns/day =     271.36


FACTOR_IX_PRODUCTION_NPT - 90,906 atoms PME
-------------------------------------------
1 x H100 GPU:      |         ns/day =     357.88
1 x 4090 GPU:      |         ns/day =     433.24
1 x 4070TI GPU:  |         ns/day =     279.19
1 x 3090 GPU:      |         ns/day =     248.65
1 x A100 GPU:      |         ns/day =     252.87


CELLULOSE_PRODUCTION_NVE - 408,609 atoms PME
--------------------------------------------
1 x H100 GPU:      |         ns/day =     119.27
1 x 4090 GPU:      |         ns/day =     129.63
1 x 4070TI GPU:  |         ns/day =     69.30
1 x 3090 GPU:      |         ns/day =      63.23
1 x A100 GPU:      |         ns/day =      85.23


CELLULOSE_PRODUCTION_NPT - 408,609 atoms PME
--------------------------------------------
1 x H100 GPU:      |         ns/day =     108.91
1 x 4090 GPU:      |         ns/day =     119.04
1 x 4070TI GPU:  |         ns/day =     64.65
1 x 3090 GPU:      |         ns/day =      58.30
1 x A100 GPU:      |         ns/day =      77.98

STMV_PRODUCTION_NPT - 1,067,095 atoms PME
-----------------------------------------
1 x H100 GPU:      |         ns/day =      70.15
1 x 4090 GPU:      |         ns/day =      78.90
1 x 4070TI GPU:  |         ns/day =     37.31
1 x 3090 GPU:      |         ns/day =      38.65
1 x A100 GPU:      |         ns/day =      52.02

TRPCAGE_PRODUCTION - 304 atoms GB
---------------------------------
1 x H100 GPU:      |         ns/day =    1413.28
1 x 4090 GPU:      |         ns/day =    1482.22
1 x 4070TI GPU:  |         ns/day =     1519.47
1 x 3090 GPU:      |         ns/day =    1225.53
1 x A100 GPU:      |         ns/day =    1040.61


MYOGLOBIN_PRODUCTION - 2,492 atoms GB
-------------------------------------
1 x H100 GPU:      |         ns/day =    1094.48
1 x 4090 GPU:      |         ns/day =     929.62
1 x 4070TI GPU:  |         ns/day =     757.91
1 x 3090 GPU:      |         ns/day =     621.73
1 x A100 GPU:      |         ns/day =     661.22


NUCLEOSOME_PRODUCTION - 25,095 atoms GB
---------------------------------------
1 x H100 GPU:      |         ns/day =      37.68
1 x 4090 GPU:      |         ns/day =      36.90
1 x 4070TI GPU:  |         ns/day =      21.34
1 x 3090 GPU:      |         ns/day =      21.08
1 x A100 GPU:      |         ns/day =      29.66
Recent Turing and Ampere benchmarks from Exxact
Some June, 2021 benchmarks for Ampere and Turing cards can be
found here:
Original benchmarks (from Ross Walker)
These are available here, for various versions of Amber:
Amber20 benchmarks (from Dave Cerutti)
We take as benchmarks four periodic systems spanning a range of system sizes and
compositions. The smallest Dihydrofolate Reductase (DHFR) case is a 159-residue protein in
water, weighing in at 23,588 atoms. Next, from the human blood clotting system, Factor IX is
a 379-residue protein also in a box of water, total 90,906 atoms. The larger cellulose system,
408,609 atoms, has a greater content of macromolecules in it: the repeating sugar polymer
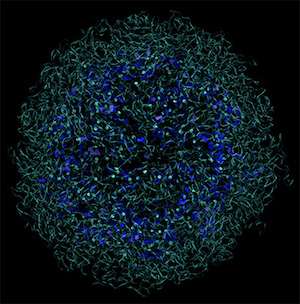
constitutes roughly a sixth of the atoms in the system. Finally, the very large simulation of
satellite tobacco mosaic virus (STMV), a gargantuan 1,067,095 atom system, also has an
appreciable macromolecule content, but is otherwise another collection of proteins in
water.
Download the Amber
20 Benchmark
Suite.
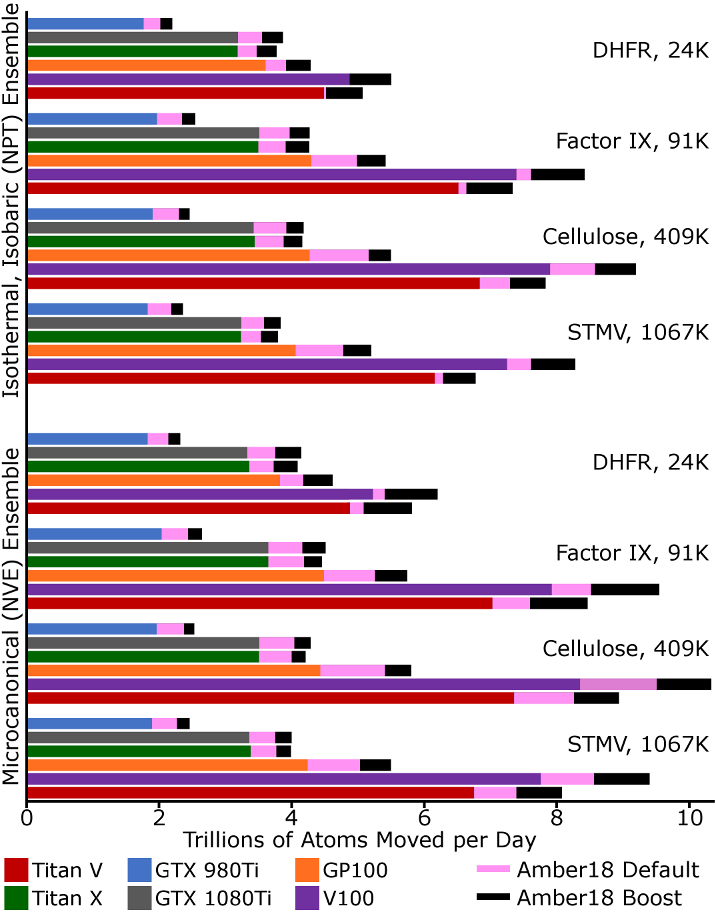
The figure below indicates the relative performance of Amber16 and Amber18, which is still
representative of Amber20, with default settings as well as "boosted" settings. We
take the unbiased metric of trillions of moves made against individual atoms per day. This
puts most systems on equal footing, but for a few factors. The identity of each system and
its atom count are given on the right hand side of the plot. All simulations were run with a
9Å cutoff and a 4fs time step. We maintained the isothermal, isobaric ensemble with a
Berendsen thermostat and Monte-Carlo barostat (trial moves to update the system volume every
100 steps). The production rates of each GPU running Amber16 are given by the solid color
bars. Additional production from Amber18 is shown as a pink extension of each bar. Further
performance enhancements gained through the "boost" input settings described below are shown as
black extensions.
Since Amber18, the code has included a default setting to eliminate net force on the system
after each time step. This is in keeping with the operations of the CPU code, so that the
system does not wander until its net momentum is stopped every nscm steps and
thermostats do their job right. In the current release, it costs about 3% of the total
run time, but the deleterious effects it is preventing may already be mitigated by conservative
settings in the force calculation, particularly those affecting the accuracy of the PME grid.
One of our developers is working on what we believe is a 'best of both worlds' solution which
will correct net forces during the PME grid calculation specifically, and will be obligatory
for negligible additional cost. This feature will be available soon.
Since release 18, Amber has allowed a limited form of "leaky pair lists" that other codes
have employed for some time. There are (always) cutoffs on both electrostatic and van-der
Waals interactions that neglect about 1 part in 100,000 or 1 part in 1,000 of these energies,
respectively. By default, we are careful to refresh the list of all non-bonded interactions
whenever it is conceivable that we might start to miss something within the cutoff. However,
in practice, we can allow particles to travel further before refreshing the pair list, and
Amber18 enables this with the skin_permit feature. A value of 0.5 will ensure
that every pair interaction is calculated. A value of 1.0 (the maximum allowed) will cause
about one interaction out of a million to be missed, and a mid-range value of 0.75 will miss
about one interaction in 50 million. Note, there are
real effects on energy conservation if one is looking
hard. The input below will omit the net force correction and then reduce the pair list
refresh rate by an amount that we think is safe, granting 8-12% additional speedup in
most systems.
&ewald
  netfrc = 0,
  skin_permit = 0.75,
&end
The chart above shows an important general result about system size and throughput. Up
until the advent of GP100, Titan V, and Volta, the run speed of a system of 25,000 atoms or
more was pretty constant as a function of size (all other settings being equal). However, for
the newer and bigger cards, the fault lines in the algorithm are becoming apparent: the faster
Pascal and Volta chips hit their stride for systems of perhaps 75,000 to half a million atoms,
lose some performance outside that range, and are under-utilized by small systems.
(We've even
found that it can improve overall throughput to run multiple GPU simulations of small systems
simultaneously on these chips--each simulation will run faster than half its normal speed.
The Multi-Process Service (MPS) feature of CUDA makes this work the best,
although it's only effective on the newest
architectures (Volta, Turing). With MPS enabled and multiple replicas engaged on the same GPU,
the smaller DHFR benchmark surges to the head of the pack in terms of atoms moved per time in
the chart above. The benefits of MPS parallelism vanish for systems larger than perhaps
100,000 atoms.
)
We've put the relative performance benchmarks up front to assure you that we are working
hard to make Amber faster and keep up with hardware trends. The improvements can be even
greater with a shorter 8Å cutoff used in
previous benchmarks, but we
wanted to present the most relevant examples. Because of the particular settings, it's not as
easy as it seems to compare codes based on benchmarks, another reason we chose to compare
performance across system sizes with the per-atom metric above. For those that just want to
see ns/day, the numbers are below.
| Dihydrofolate Reductase (JAC, 23,558 atoms) |
| GPU Type |
NVE Ensemble |
NPT Ensemble |
|
Amber20, Default |
Amber20, Boost |
Amber20, Default |
Amber20, Boost |
| V100 |
934 |
1059 |
895 |
1003 |
| Titan-V |
920 |
1048 |
893 |
1011 |
| RTX-5000 |
683 |
754 |
666 |
734 |
| GP100 |
745 |
836 |
720 |
801 |
| Titan-X |
631 |
692 |
587 |
639 |
| RTX-2080TI |
915 |
1033 |
847 |
948 |
| RTX-2080 |
751 |
830 |
691 |
773 |
| GTX-1080Ti |
680 |
752 |
661 |
721 |
| GTX-980Ti |
361 |
392 |
341 |
372 |
| 8X CPU |
17.0 |
GPU Only |
18.6 |
GPU Only |
| 1X CPU |
2.8 |
GPU Only |
2.8 |
GPU Only |
| Factor IX (90,906 atoms) |
| GPU Type |
NVE Ensemble |
NPT Ensemble |
|
Amber20, Default |
Amber20, Boost |
Amber20, Default |
Amber20, Boost |
| V100 |
365 |
406 |
345 |
384 |
| Titan-V |
345 |
387 |
328 |
365 |
| RTX-5000 |
218 |
235 |
212 |
227 |
| GP100 |
236 |
260 |
229 |
251 |
| Titan-X |
184 |
187 |
172 |
196 |
| RTX-2080Ti |
320 |
354 |
300 |
329 |
| RTX-2080 |
233 |
257 |
221 |
240 |
| GTX-1080Ti |
196 |
213 |
189 |
204 |
| GTX-980Ti |
107 |
116 |
103 |
112 |
| 8X CPU |
4.3 |
GPU Only |
4.3 |
GPU Only |
| 1X CPU |
0.64 |
GPU Only |
0.64 |
GPU Only |
| Cellulose (408,609 atoms) |
| GPU Type |
NVE Ensemble |
NPT Ensemble |
|
Amber20, Default |
Amber20, Boost |
Amber20, Default |
Amber20, Boost |
| V100 |
88.9 |
96.2 |
84.3 |
90.8 |
| Titan-V |
82.2 |
87.9 |
78.1 |
83.2 |
| RTX-5000 |
46.6 |
48.7 |
45.1 |
47.3 |
| GP100 |
53.8 |
57.5 |
52.0 |
55.3 |
| Titan-X |
39.0 |
41.1 |
37.8 |
40.6 |
| RTX-2080Ti |
68.0 |
72.6 |
64.8 |
68.6 |
| RTX-2080 |
48.2 |
51.4 |
46.1 |
48.8 |
| GTX-1080Ti |
42.9 |
45.3 |
40.8 |
43.2 |
| GTX-980Ti |
23.2 |
24.7 |
22.4 |
24.0 |
| 8X CPU |
0.87 |
GPU Only |
0.78 |
GPU Only |
| 1X CPU |
0.13 |
GPU Only |
0.13 |
GPU Only |
| (Satellite Tobacco Mosaic Virus 1,067,095 atoms) |
| GPU Type |
NVE Ensemble |
NPT Ensemble |
|
Amber20, Default |
Amber20, Boost |
Amber20, Default |
Amber20, Boost |
| V100 |
30.4 |
33.5 |
28.1 |
31.3 |
| Titan-V |
28.0 |
30.5 |
26.4 |
28.7 |
| RTX-5000 |
16.3 |
17.4 |
15.6 |
16.6 |
| GP100 |
19.1 |
20.9 |
18.3 |
19.9 |
| RTX-2080Ti |
23.4 |
25.5 |
22.0 |
23.7 |
| RTX-2080 |
16.8 |
18.1 |
15.7 |
17.0 |
| Titan-X |
14.1 |
14.9 |
13.2 |
14.2 |
| GTX-1080Ti |
14.4 |
15.4 |
13.9 |
14.6 |
| GTX-980Ti |
8.5 |
9.2 |
8.1 |
8.8 |
| 8X CPU |
0.30 |
GPU Only |
0.26 |
GPU Only |
| 1X CPU |
0.05 |
GPU Only |
0.05 |
GPU Only |
We have always sought the best possible results on a range of GPU hardware. In early
versions of Amber18, there was a special -volta flag for optimizing performance on the advanced
V100 and Titan-V cards. This is no longer needed in Amber 20--standard compilation will always
deliver the best results.
The code that executes the non-periodic, implicit solvent GB in Amber20 has not changed
much since Amber16, nor has its performance. The way we do bonded interactions results in a
mild decrease in GB performance for very small systems, but the big story is the inverse
squared relationship in the system size to GB performance as a whole, compared to the steady
production rates one gets out of PME simulations. A table of numbers in ns/day is given
below. Note that all benchmarks have been updated to run on a 4fs time step.
|
Generalized Born Timings in Amber20 |
| GPU Type |
Trp Cage (304 atoms) |
Myoglobin (2,492 atoms) |
Nucleosome (25,095 atoms) |
| V100 |
2801 |
1725 |
48.5 |
| Titan-V |
2782 |
1681 |
43.9 |
| RTX-5000 |
2482 |
1060 |
23.3 |
| GP100 |
2986 |
1223 |
25.0 |
| RTX-2080Ti |
2521 |
1252 |
30.2 |
| RTX-2080 |
2400 |
1017 |
21.1 |
| Titan-X |
2690 |
870 |
15.7 |
| GTX-1080Ti |
2933 |
875 |
18.4 |
| GTX-980Ti |
1815 |
596 |
11.1 |
| 8X CPU |
422 |
9.3 |
0.1 |
| 1X CPU |
70.8 |
1.5 |
0.02 |
For production MD, if one merely wants sampling, these timings would suggest that the
crossover point lies somewhere in the realm of a 4,000 atom protein. In explicit solvent,
such a system would contain roughly 40,000 atoms and would be expected to run about 700 ns/day
in an NVT ensemble. The corresponding GB implicit solvent simulation would also produce about
as much. GB simulations carry an added sampling advantage in that they remove solvent friction
to allow more extensive side chain sampling, so larger biomolecules, perhaps even the 25,095
atom nucleosome, will sample their conformational spaces faster in GB simulations than in
explicit solvent. For more details see: Anandakrishnan, R., Drozdetski, A., Walker, R.C.,
Onufriev, A.V., "Speed of Conformational Change: Comparing Explicit and Implicit Solvent
Molecular Dynamics Simulations", Biophysical Journal, 2015, 108, 1153-1164, DOI:
10.1016/j.bpj.2014.12.047. If the
accuracy of the solvent conditions is a concern, explicit solvent conditions are
preferable.
Alternate (Amber18) benchmarks (from Ross Walker)
This benchmark suite was originally developed for AMBER10, (support for 4fs HMR was
introduced with AMBER14) and while some of the settings for production MD simulations have
evolved over time this benchmark set is still useful for comparing with historical versions of
the AMBER software and previous hardware generations.
Results for this benchmark set using previous versions of AMBER and GPU hardware are
available here:
List of Benchmarks
Explicit Solvent
- DHFR NVE HMR 4fs = 23,558 atoms
- DHFR NPT HMR 4fs = 23,558 atoms
- DHFR NVE 2fs = 23,558 atoms
- DHFR NPT 2fs = 23,558 atoms
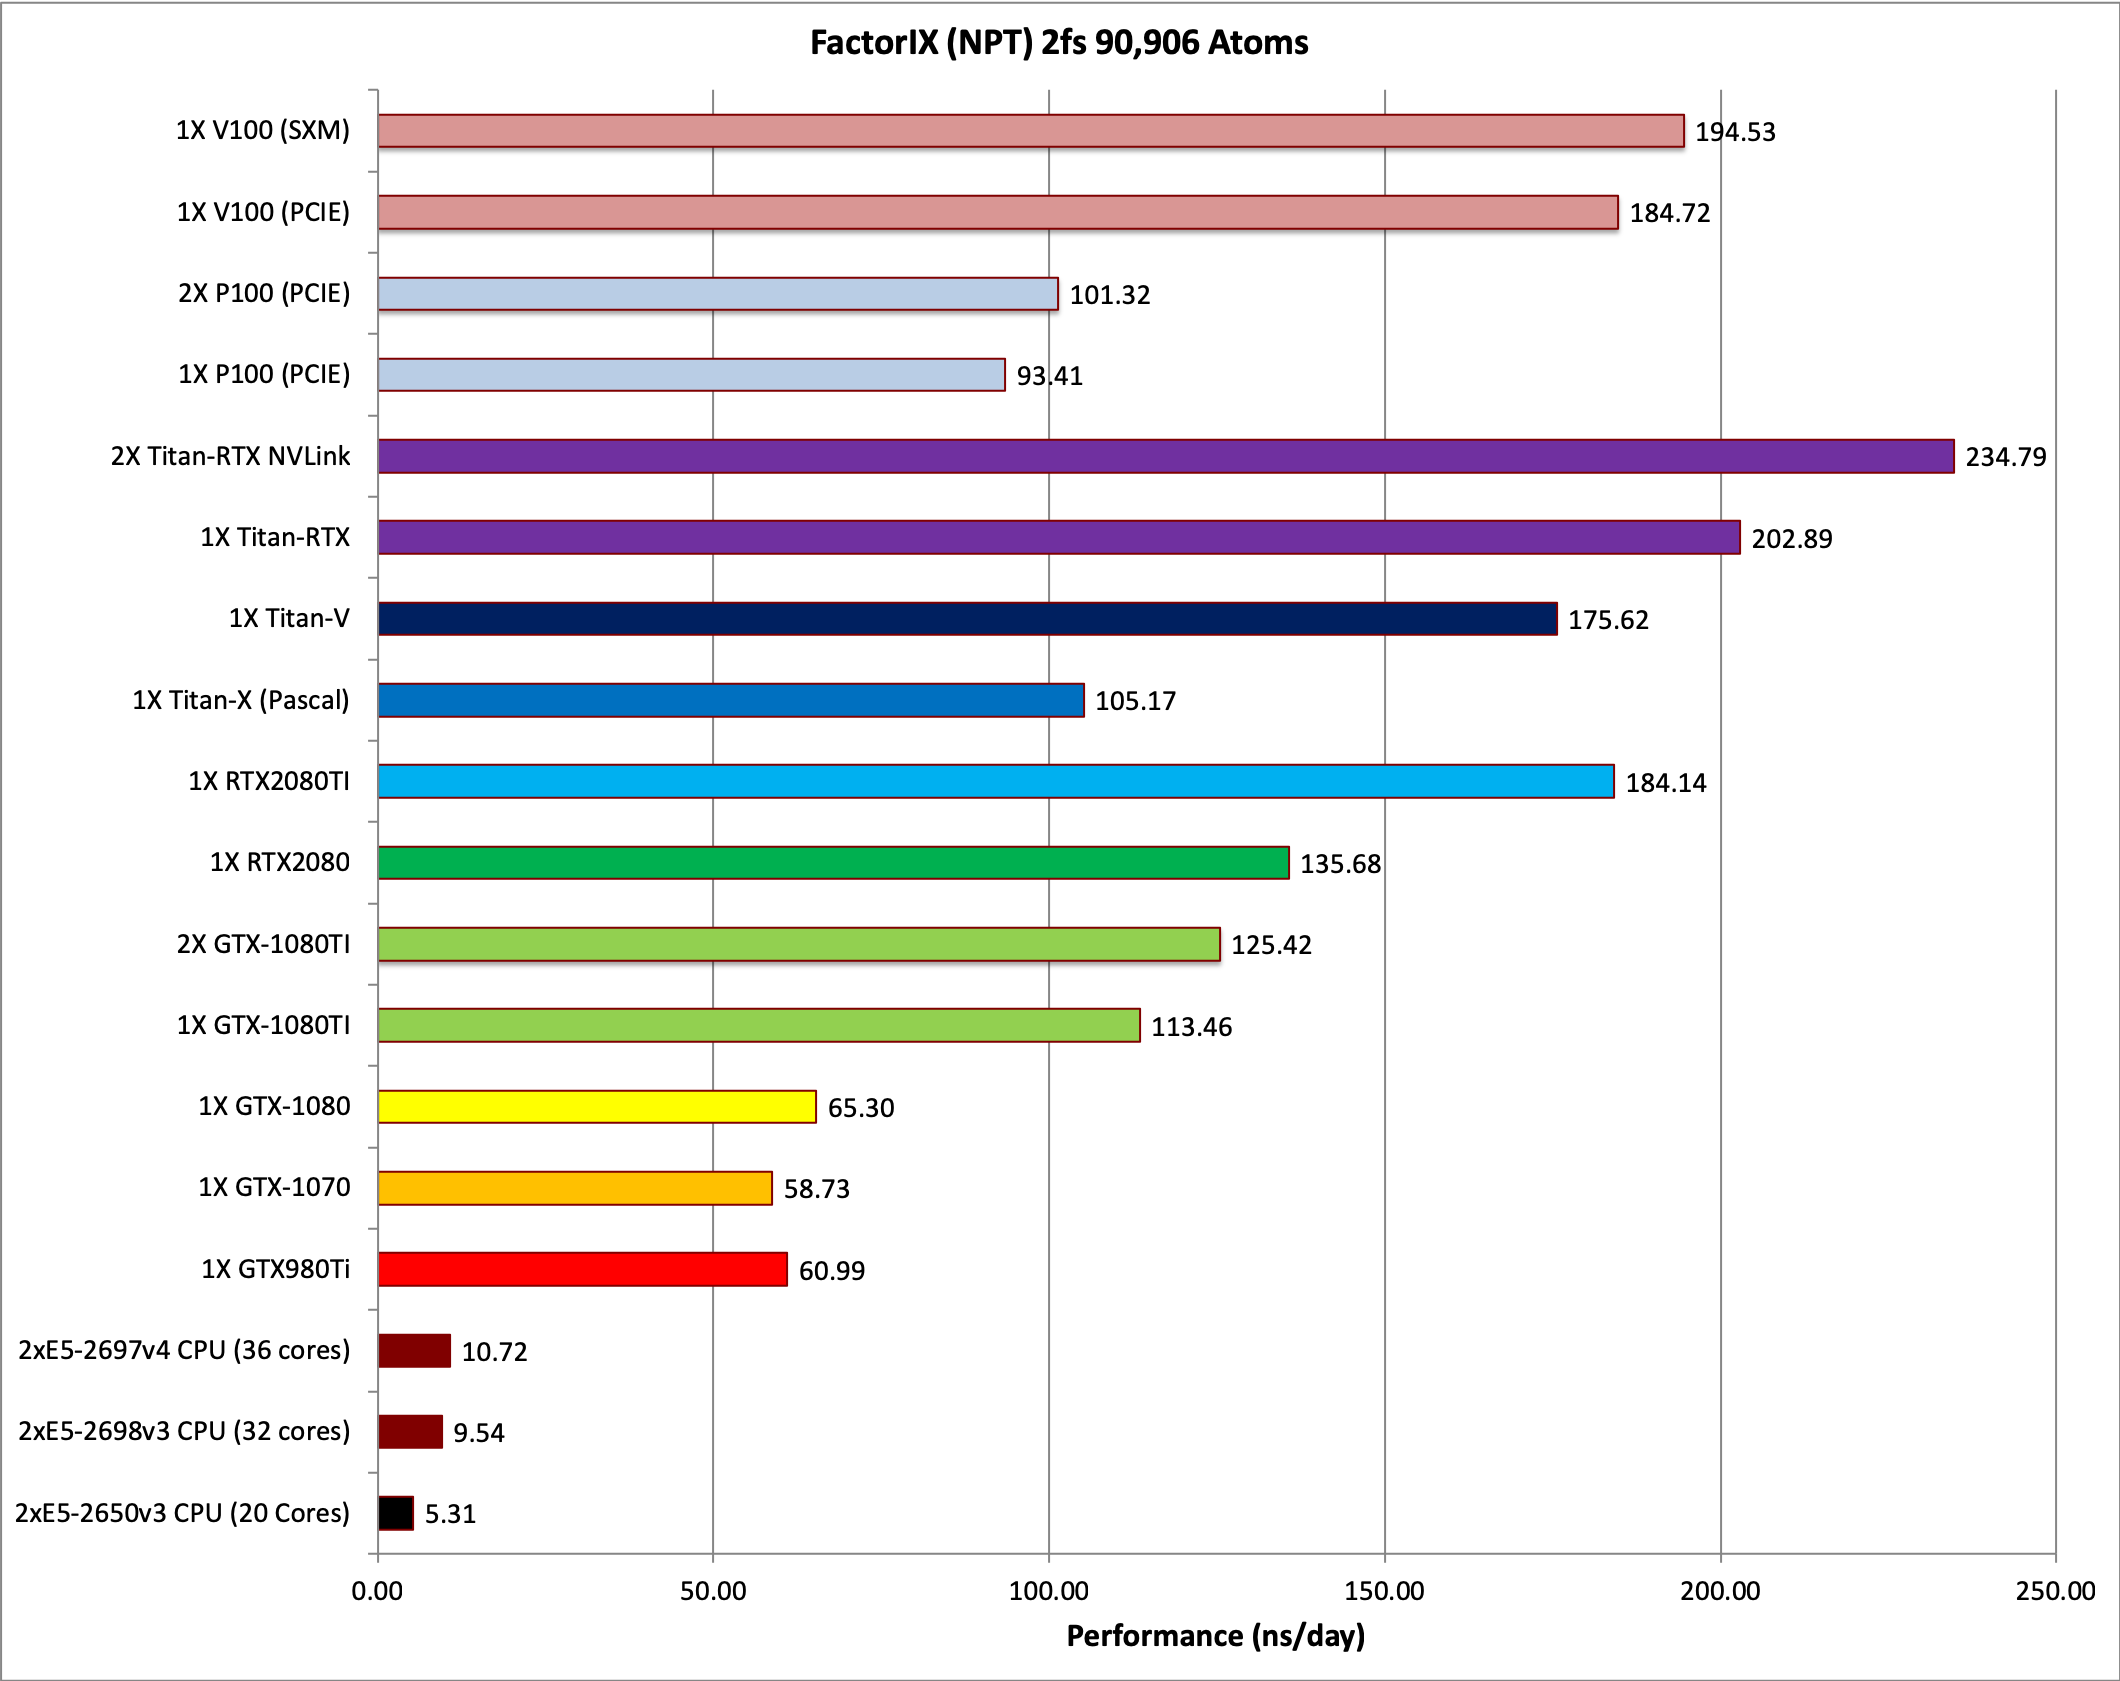
- FactorIX NVE 2fs = 90,906 atoms
- FactorIX NPT 2fs = 90,906 atoms
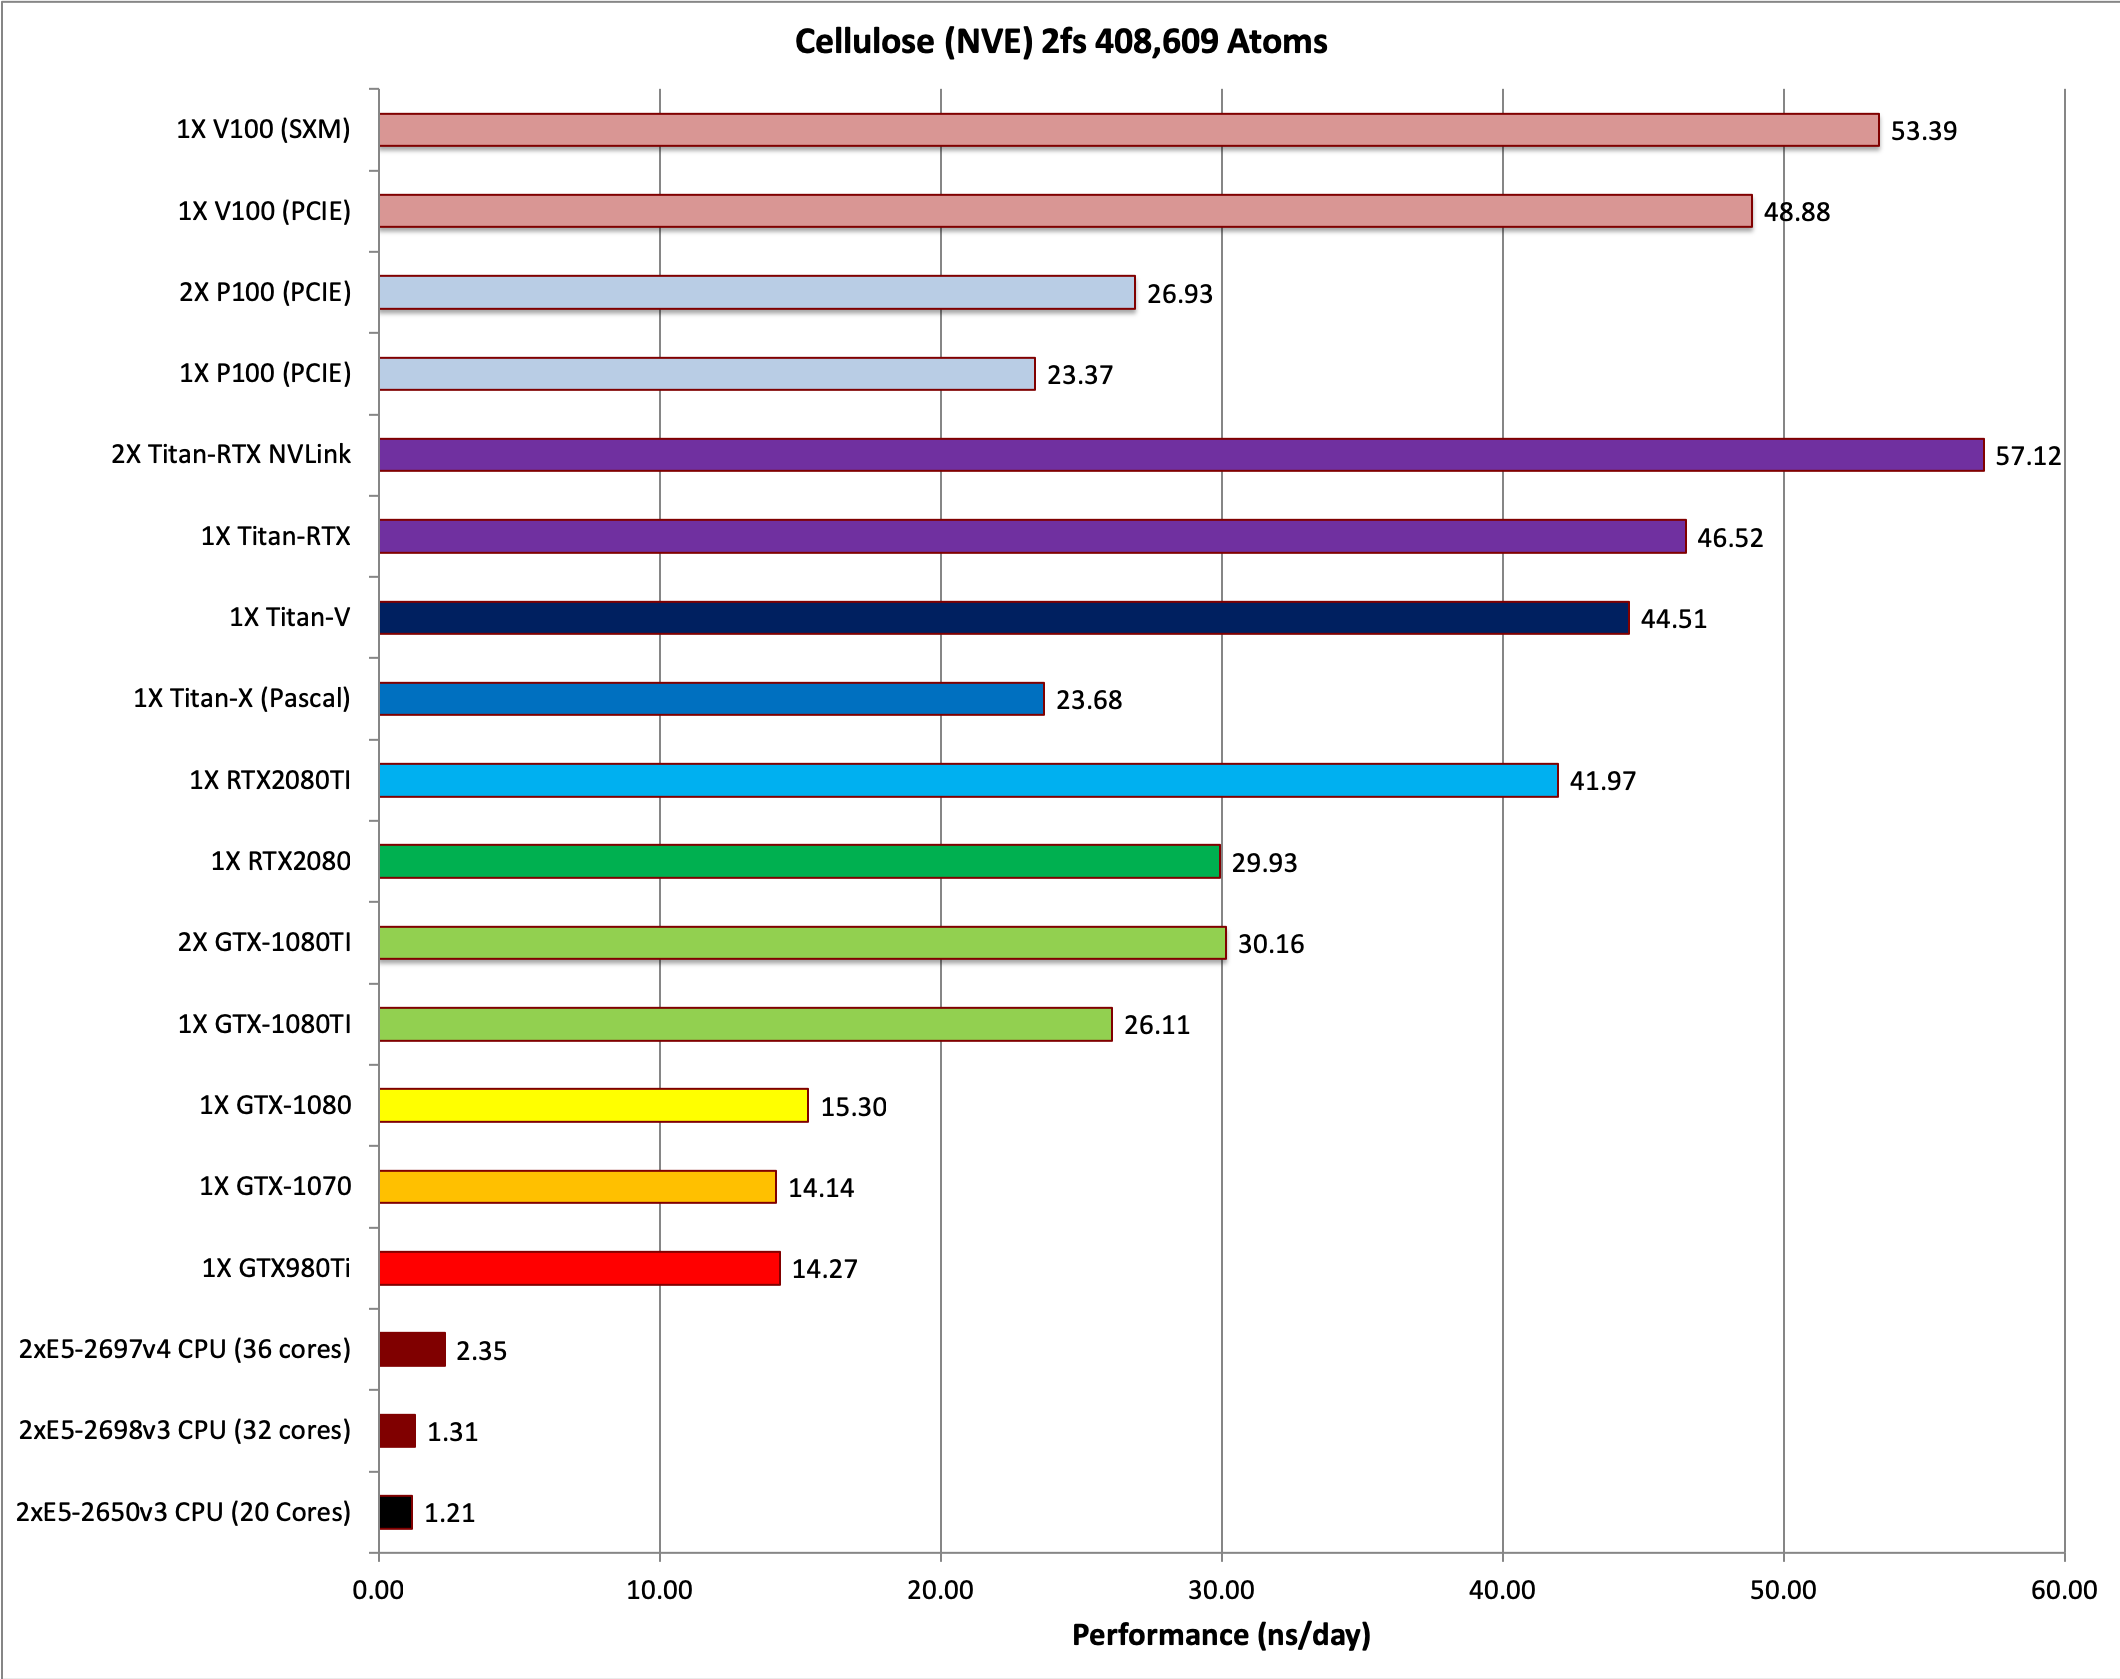
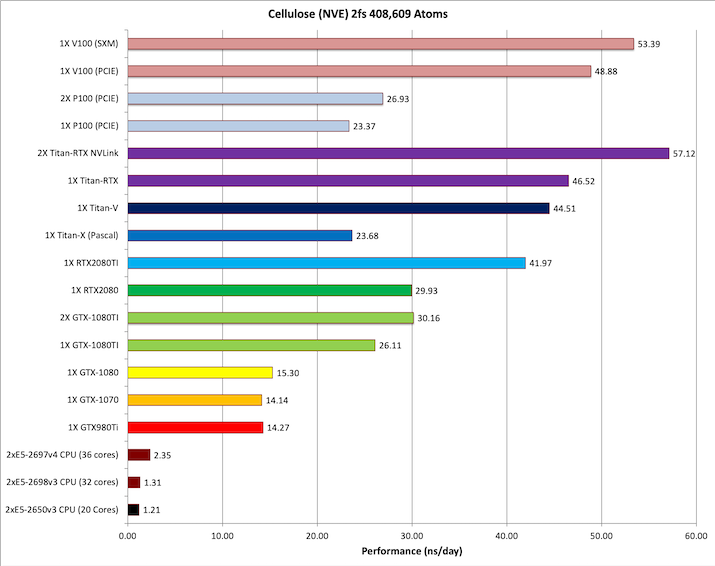
- Cellulose NVE 2fs= 408,609 atoms
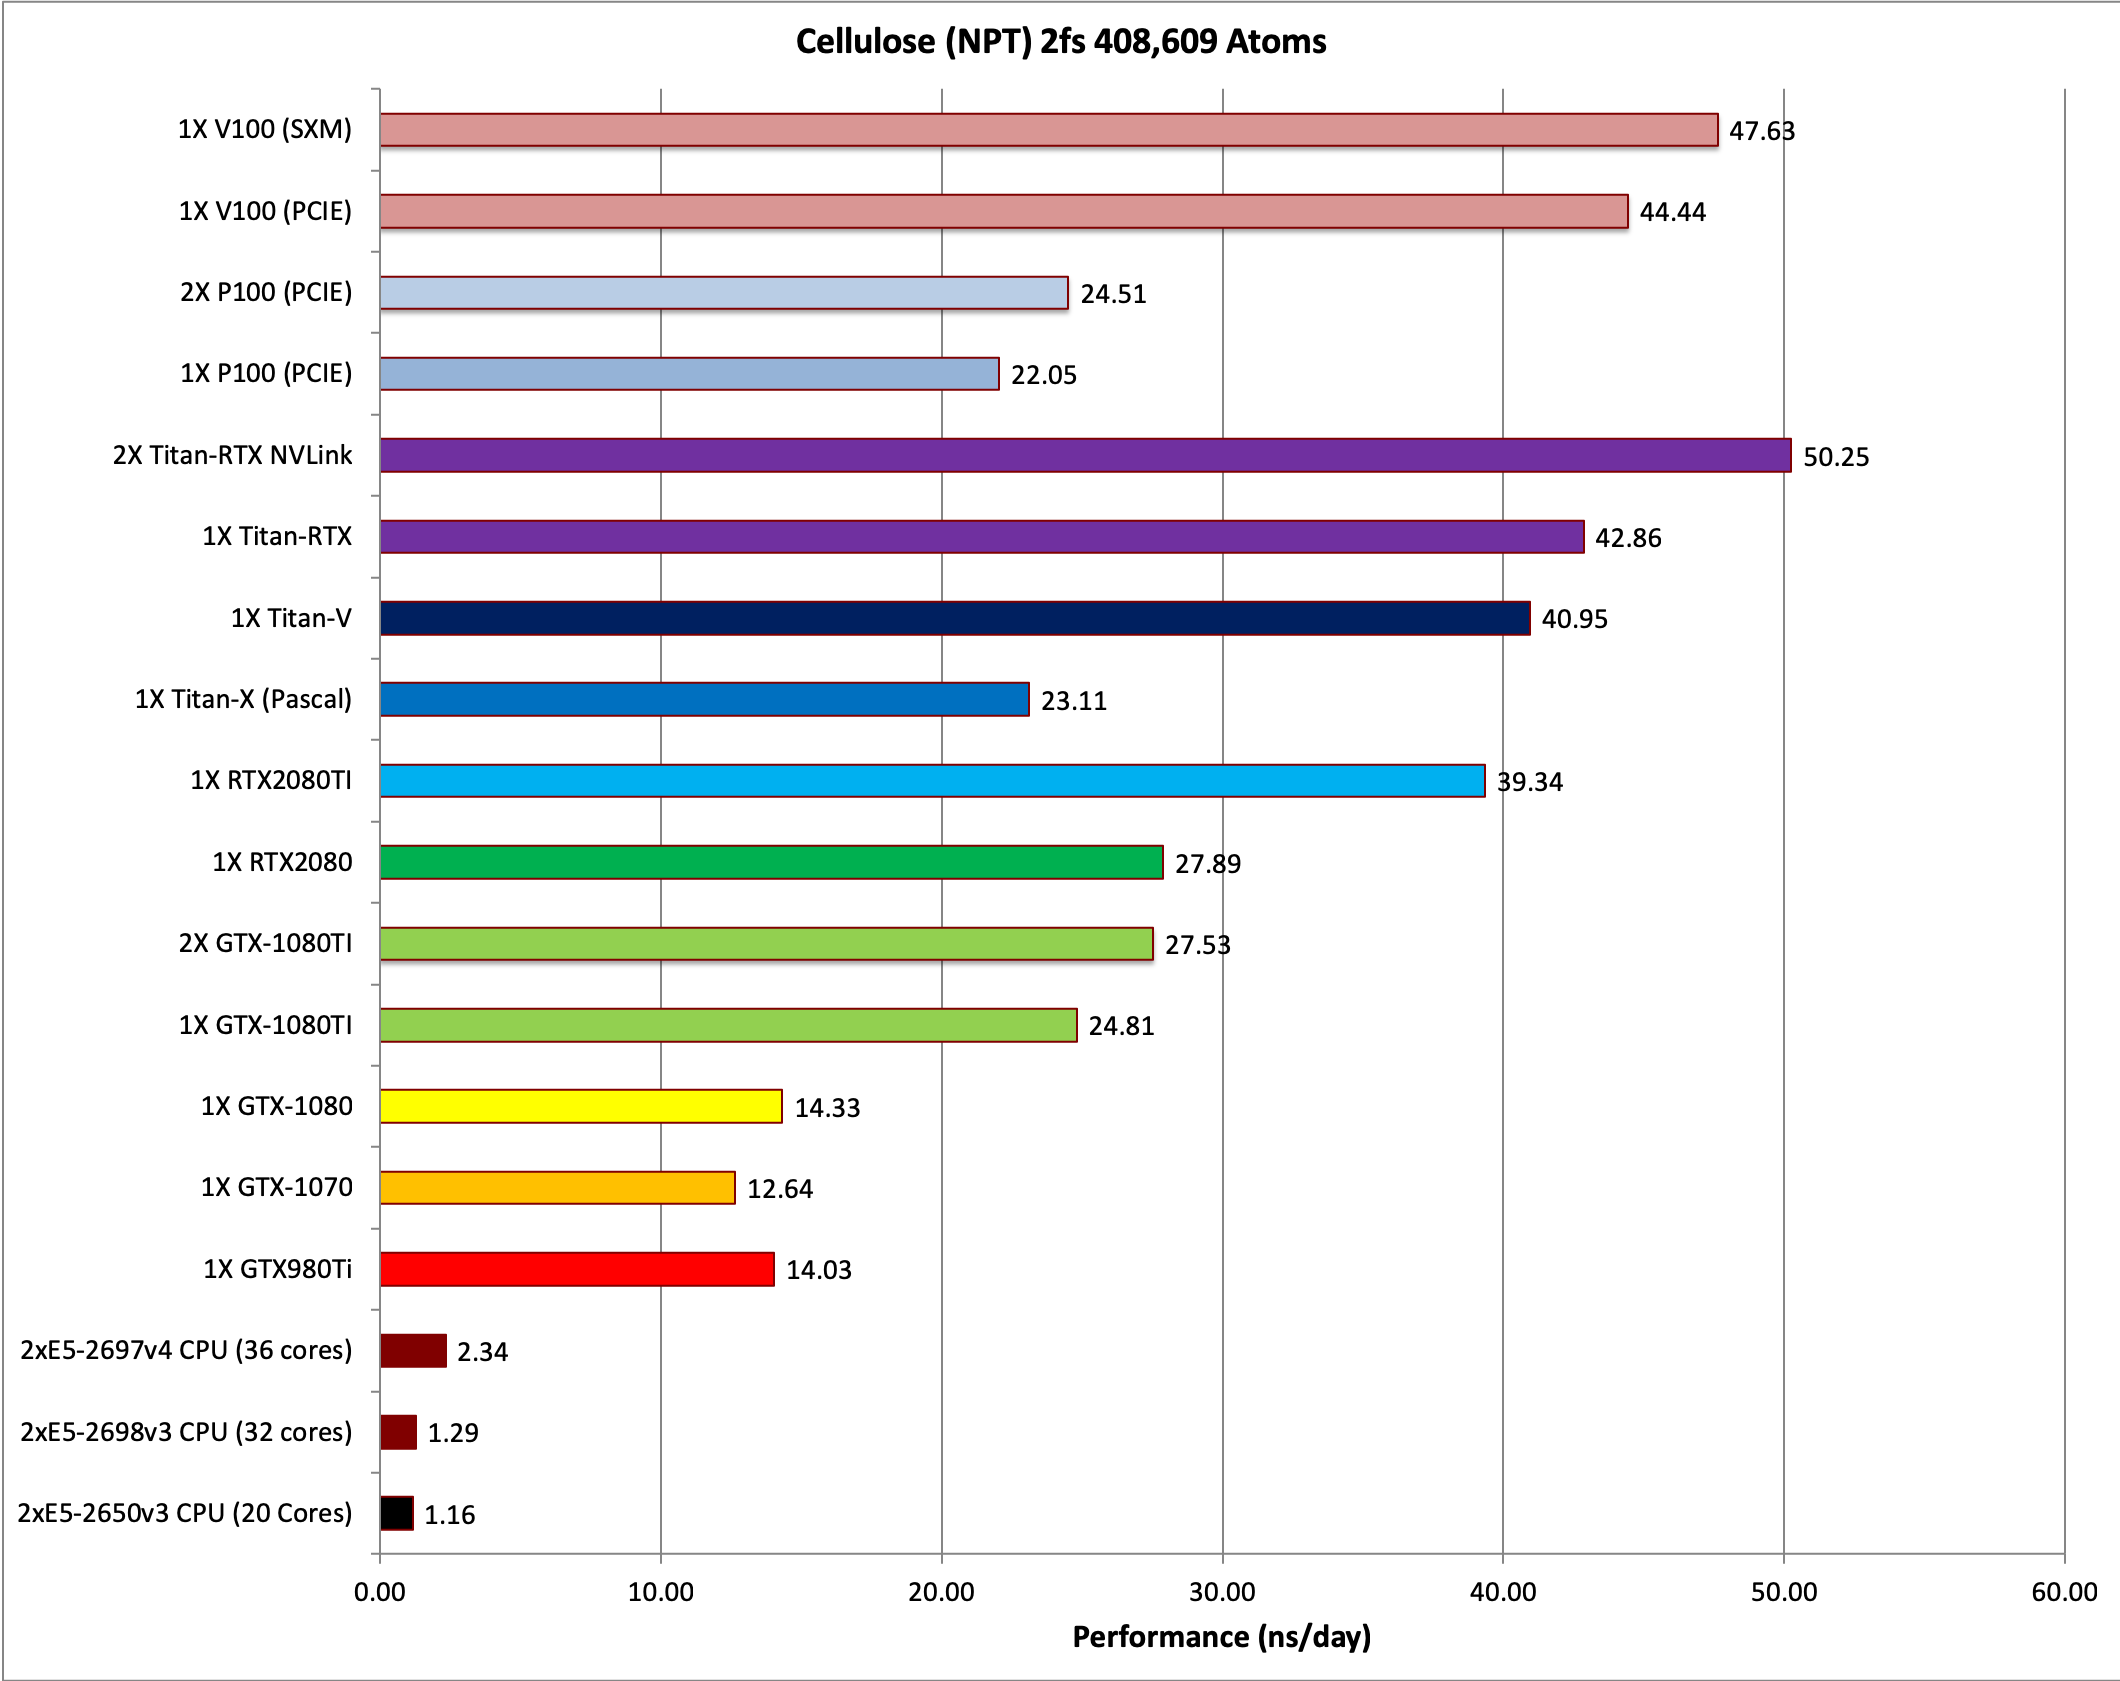
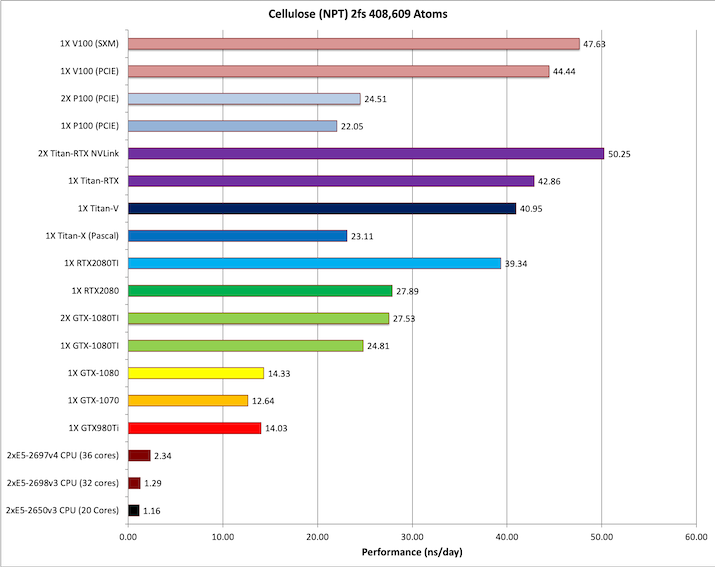
- Cellulose NPT 2fs = 408,609 atoms
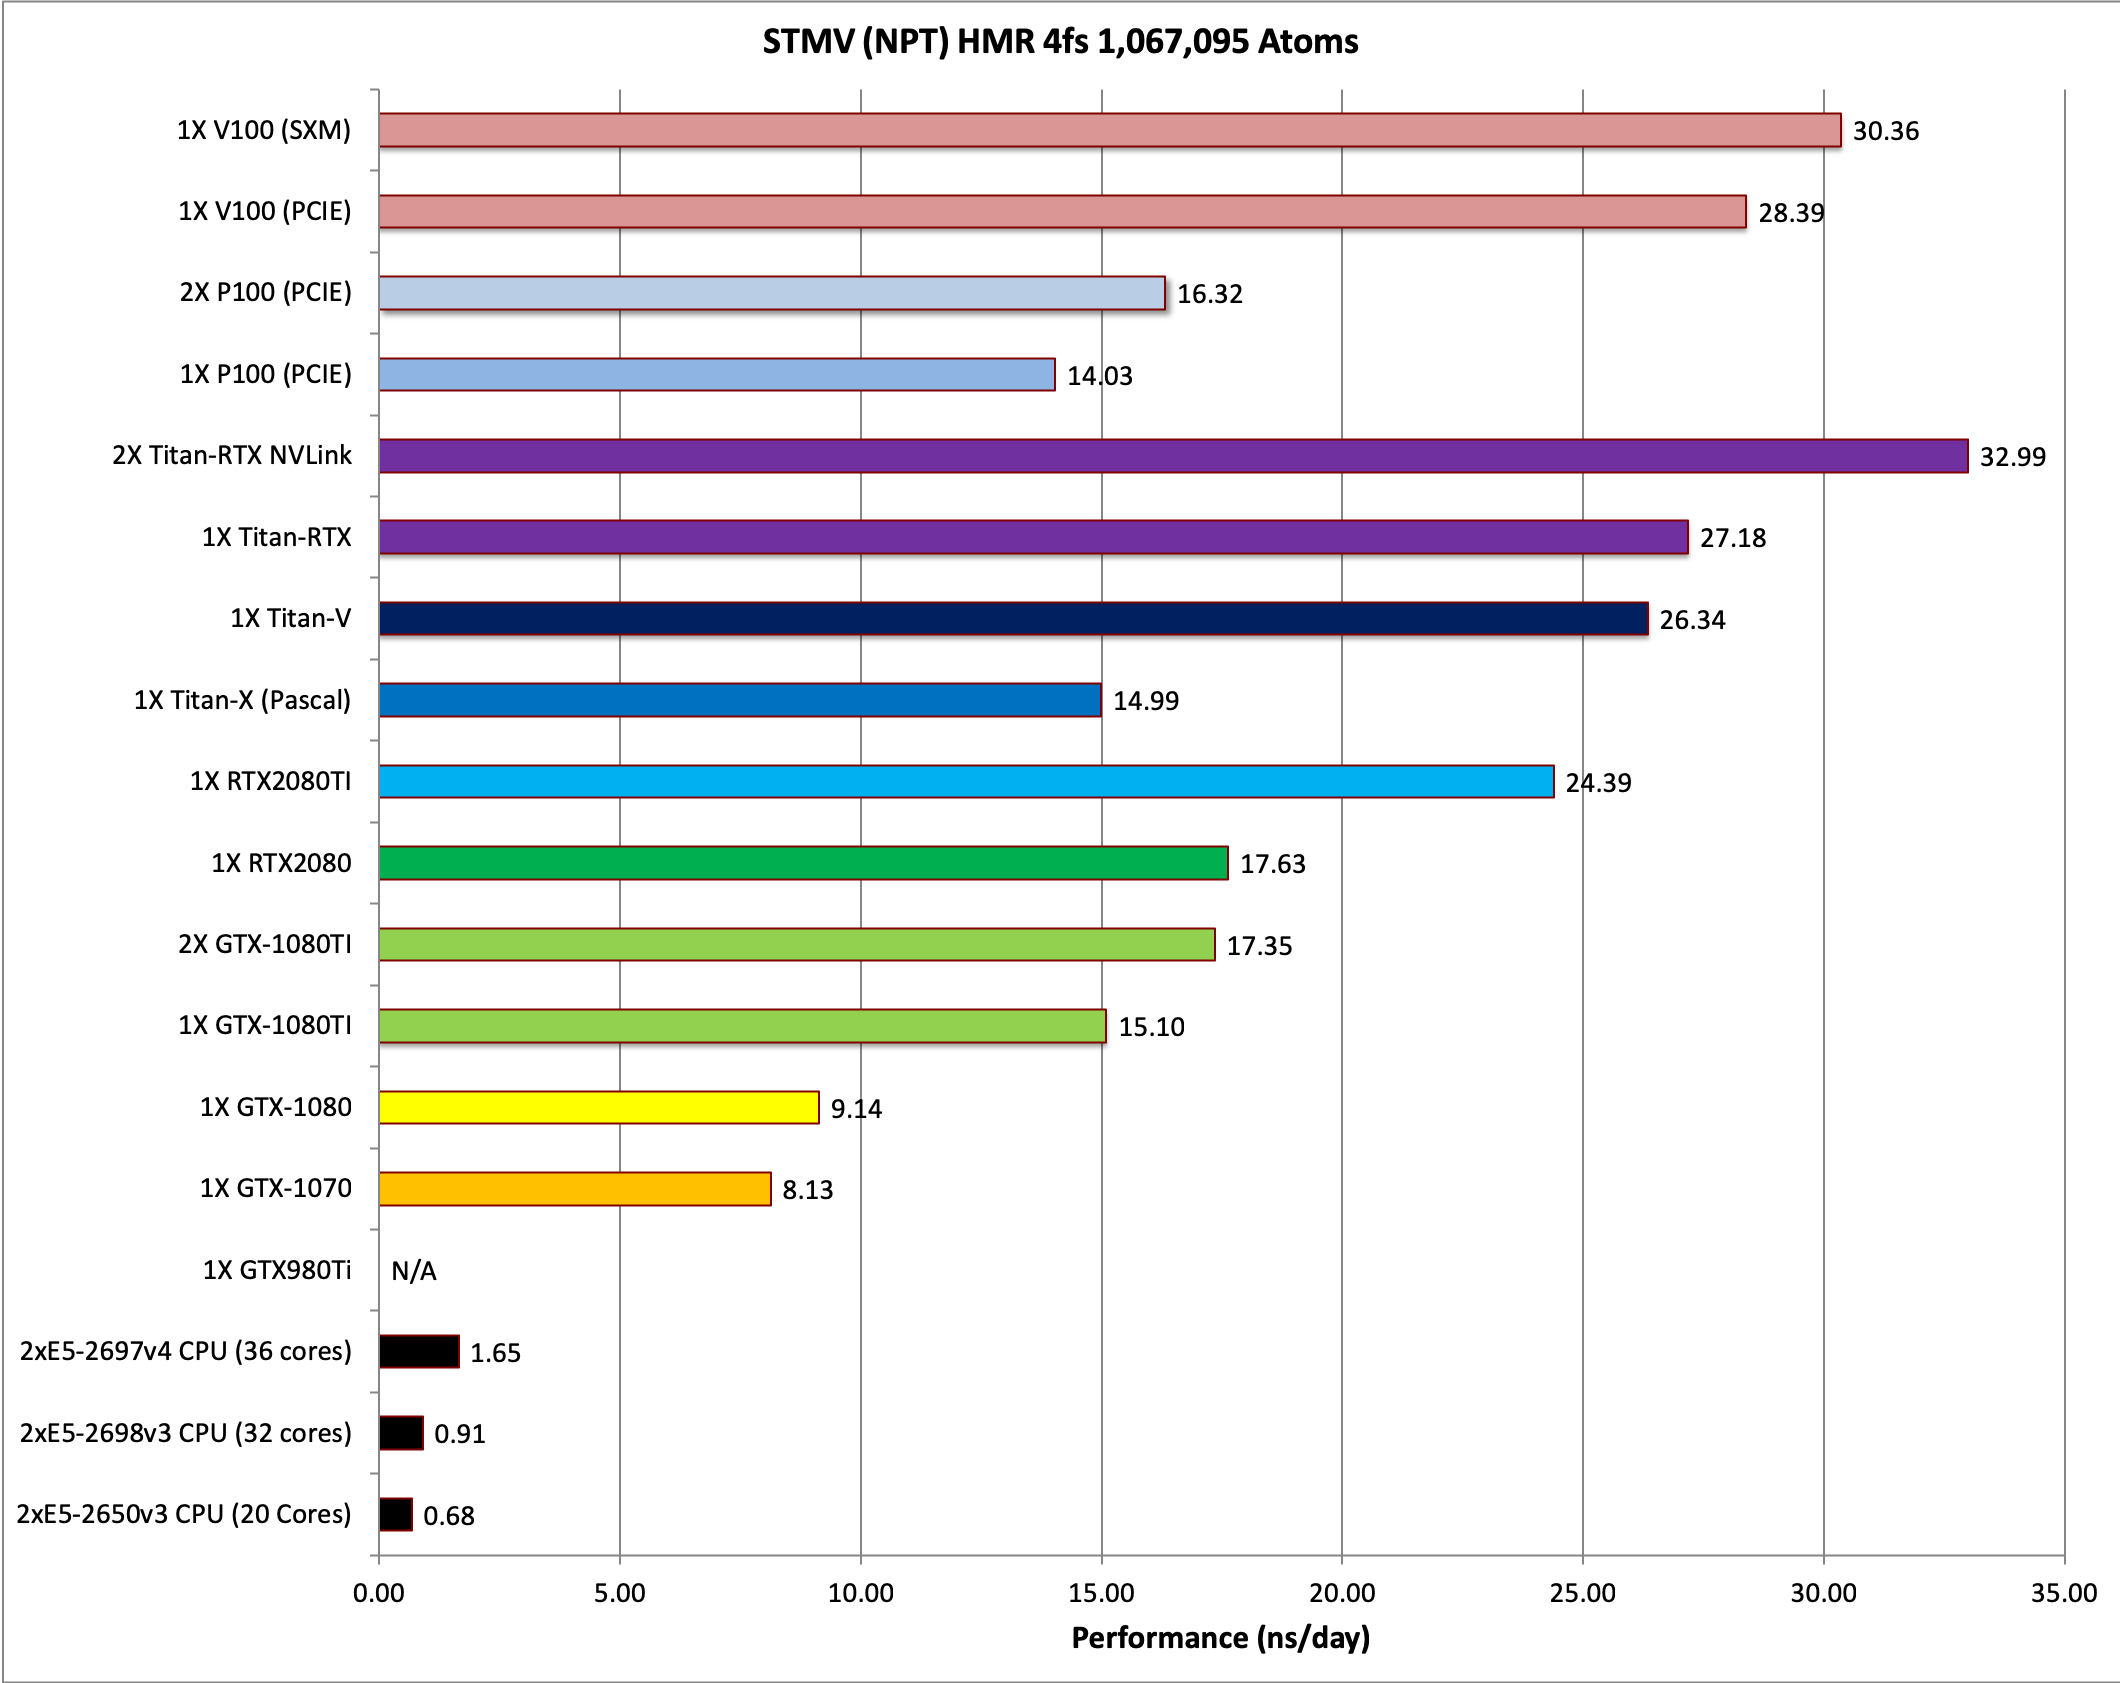
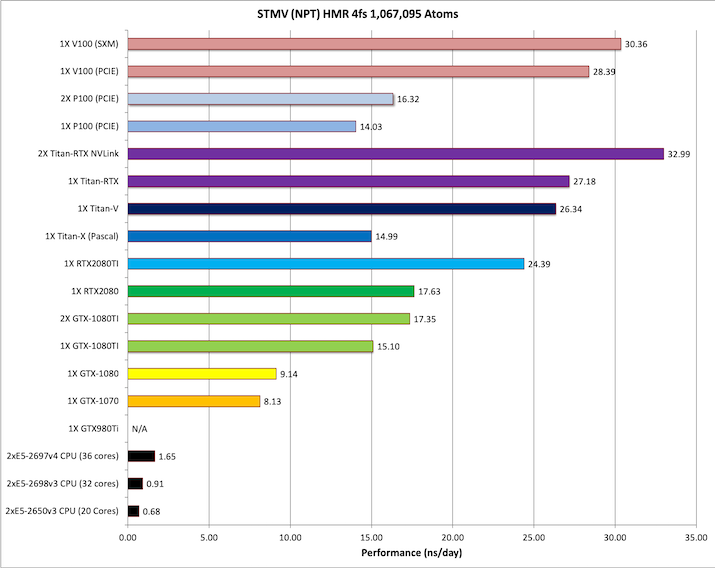
- STMV NPT HMR 4fs = 1,067,095 atoms
Implicit Solvent
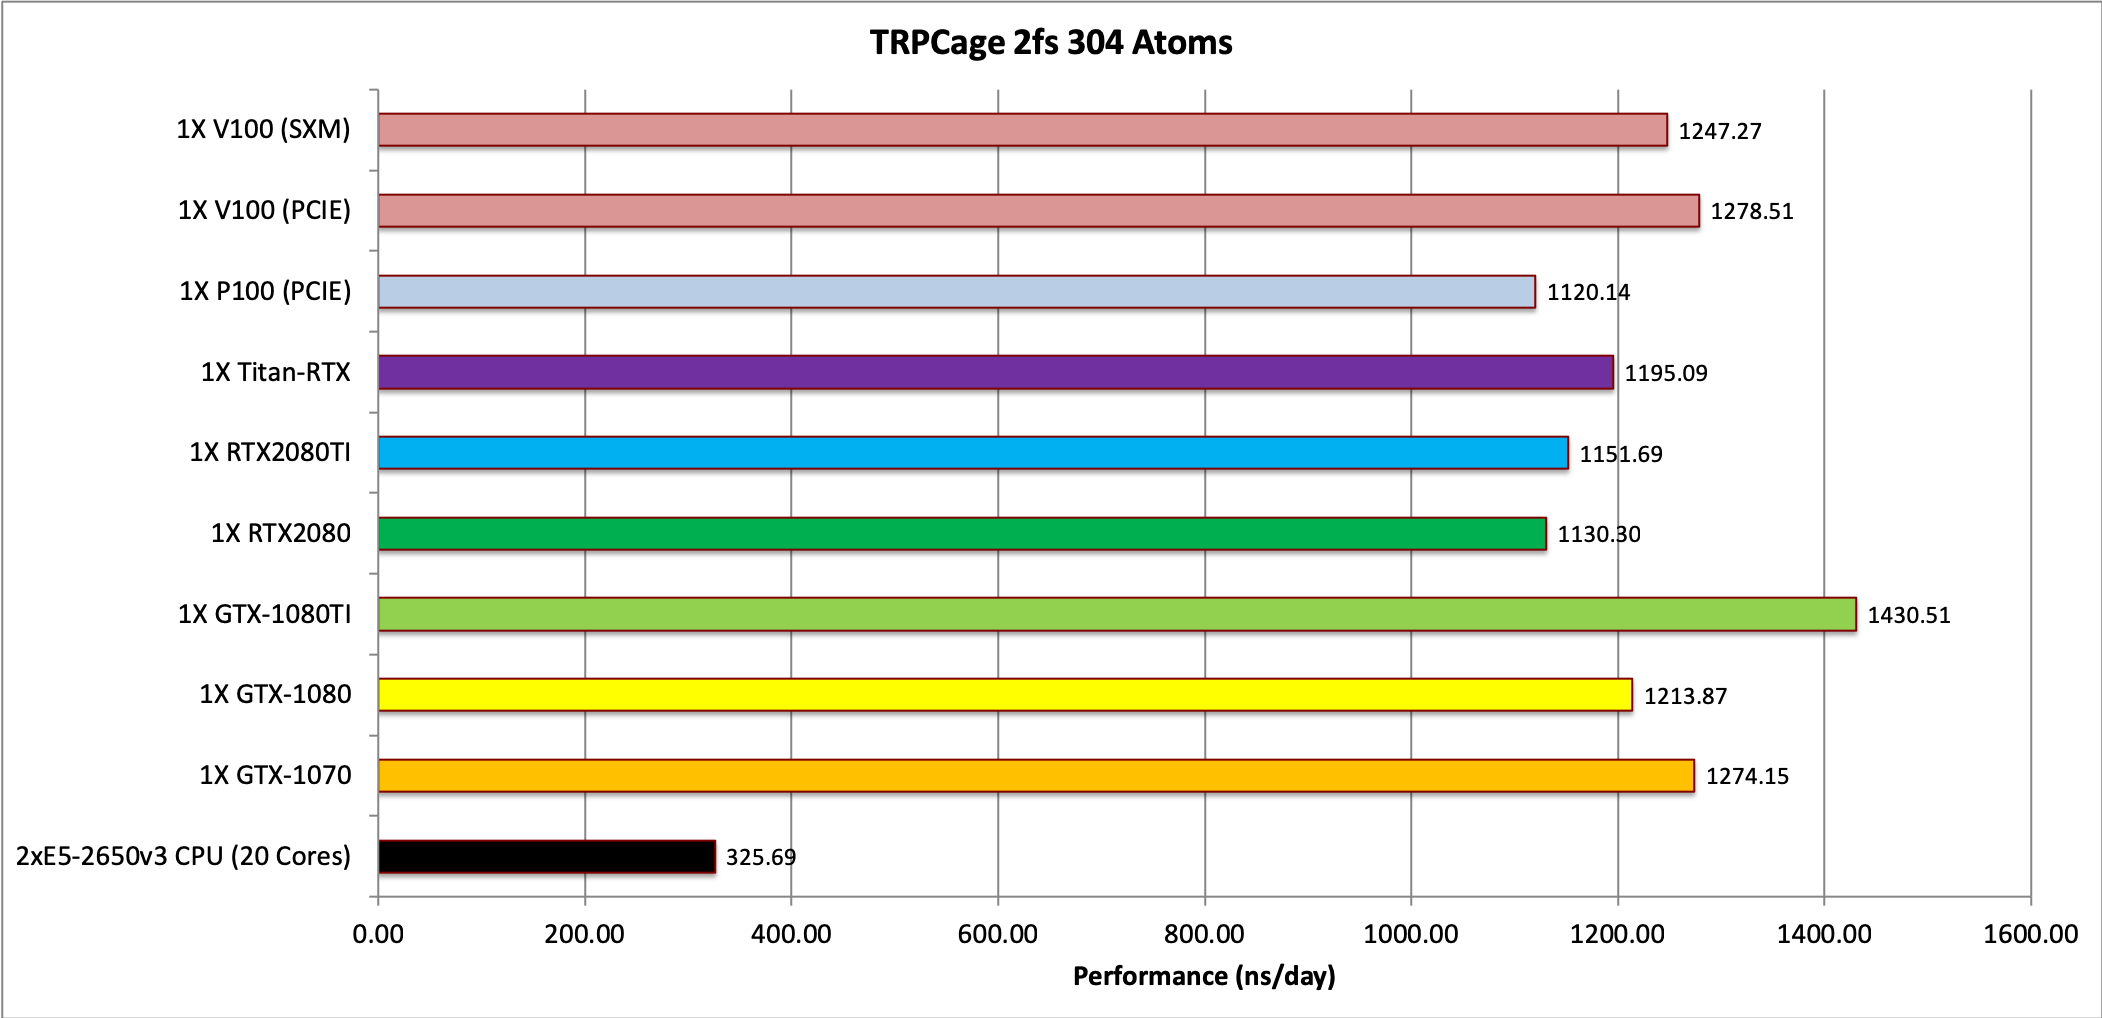
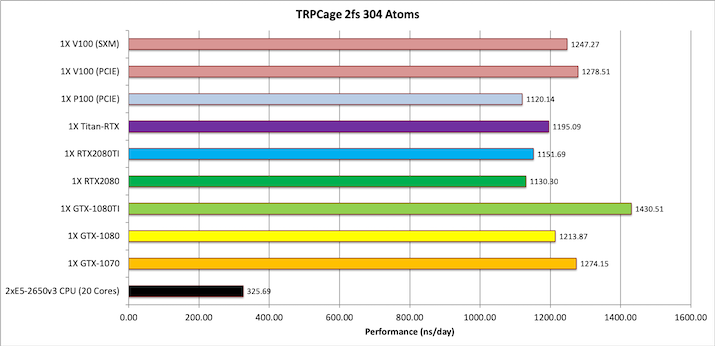
- TRPCage 2fs = 304 atoms
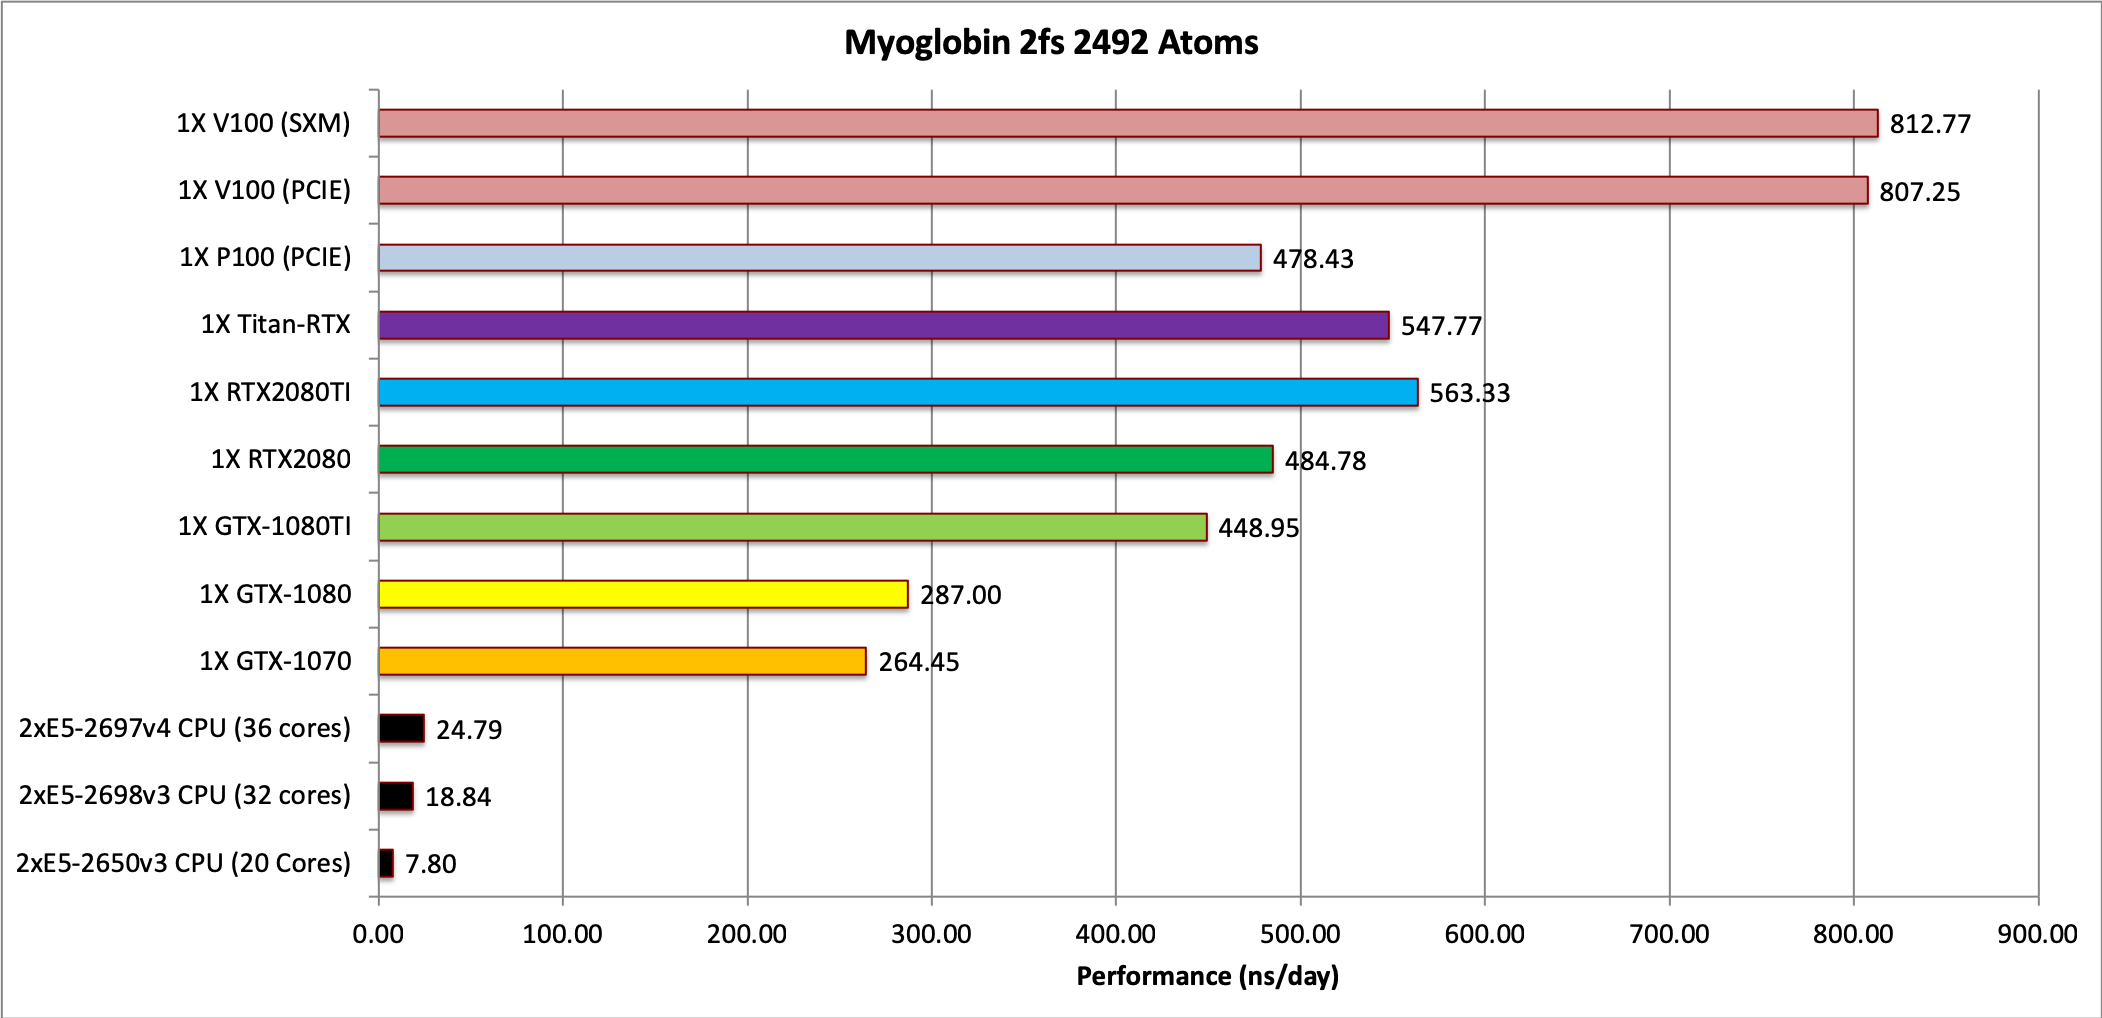
- Myoglobin = 2,492 atoms
- Nucleosome = 25,095 atoms
You can download a tar file of these benchmarks
here (84.1 MB)
Click Images for Larger Versions
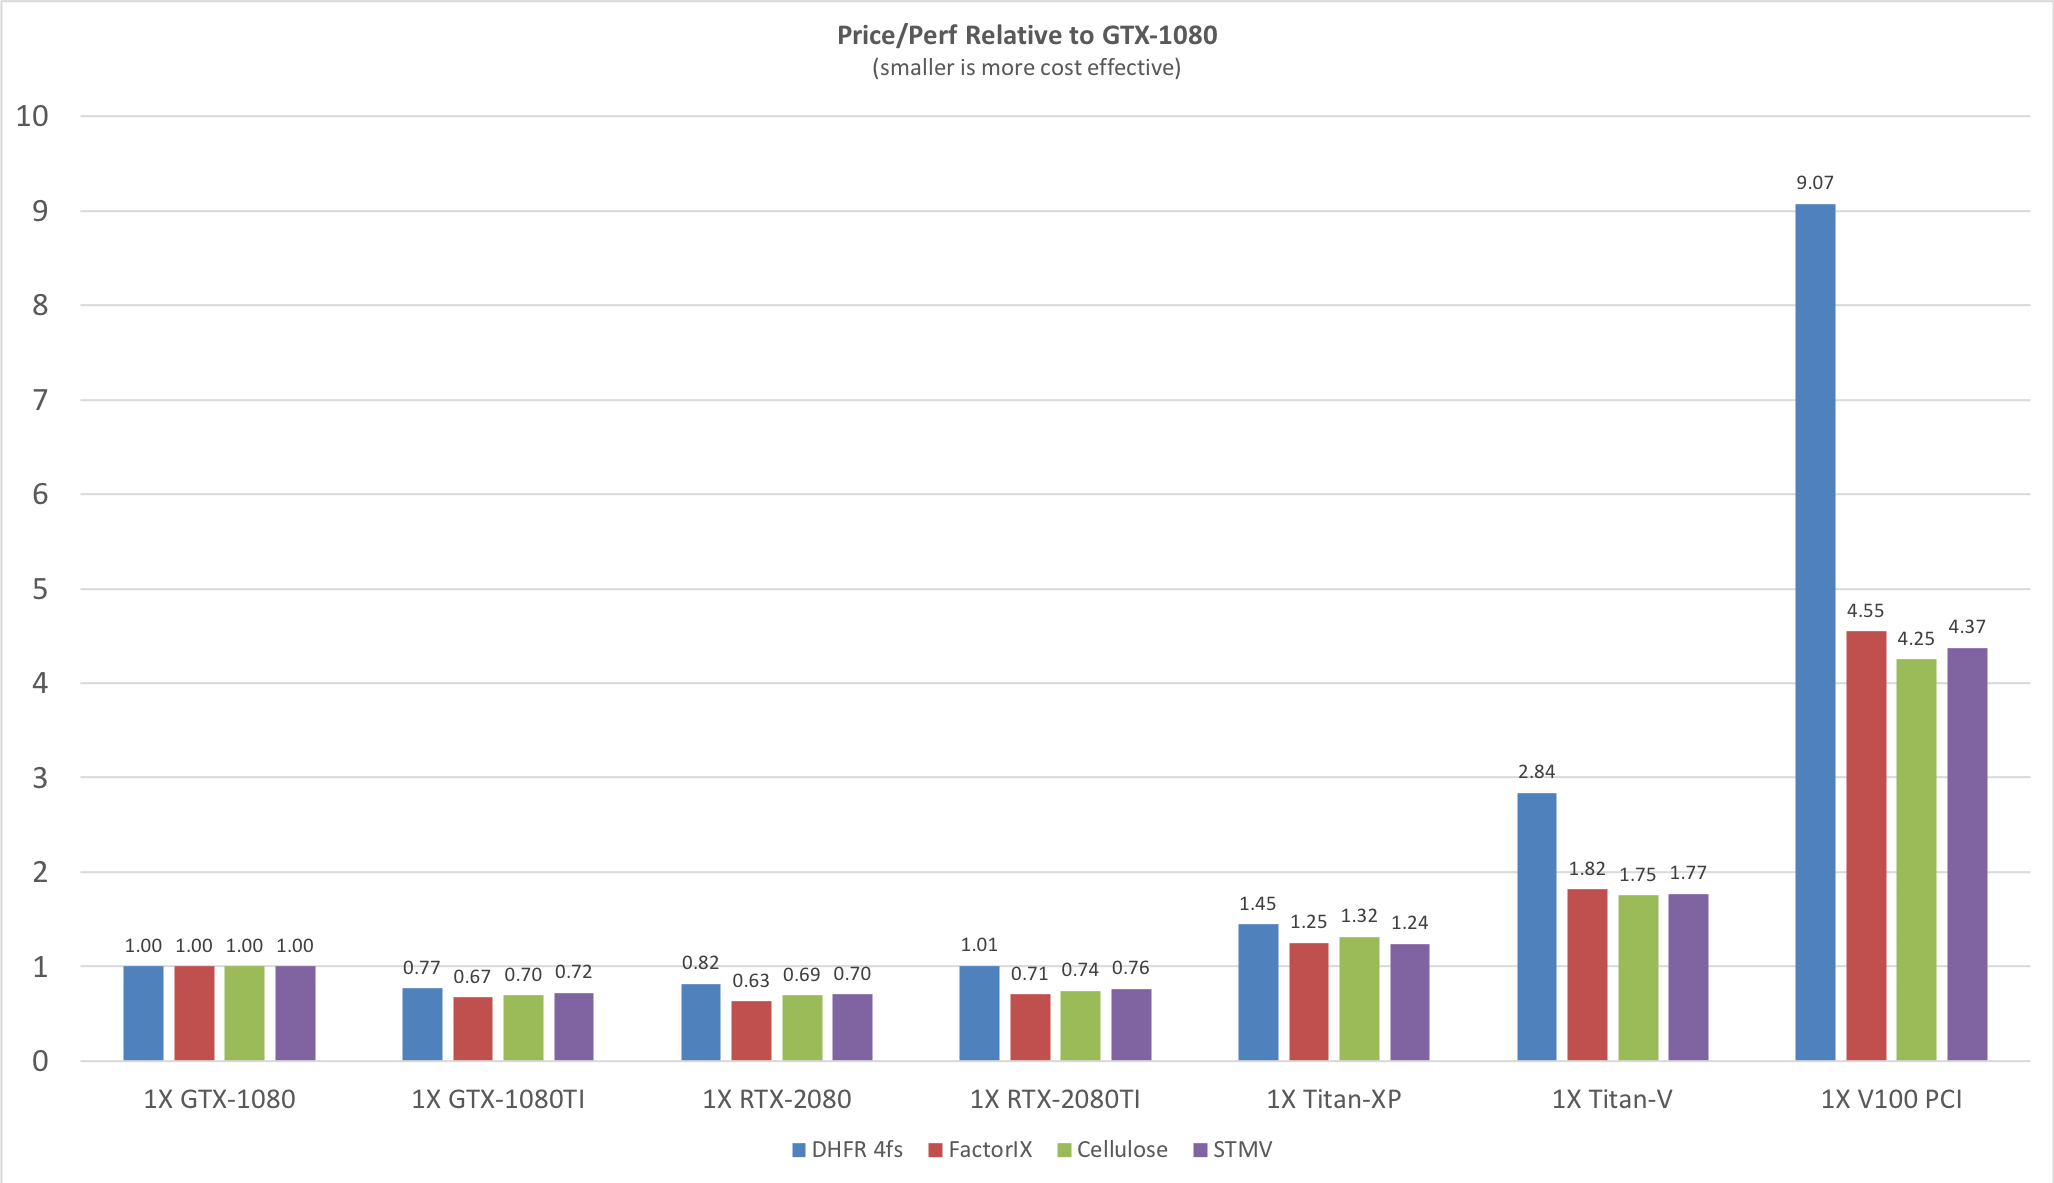
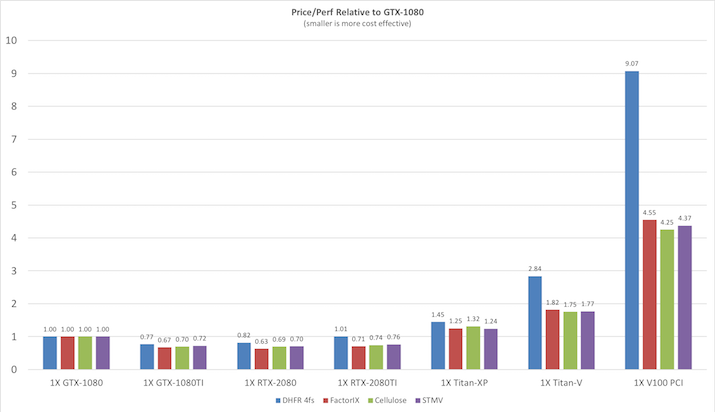
Price / Performance
Before looking at the raw throughput performance of each of the various benchmarks on
different GPU models it is useful to consider the price/performance since NVIDIA GPUs prices
span a very large range from the cost effective GeForce cards to the latest eye-wateringly
expensive Tesla V100 cards. The following plot shows the price / performance ratio relative to
the GTX1080 GPU for current GeForce and Tesla GPUs at prices as of Oct 2018. Smaller is
better.
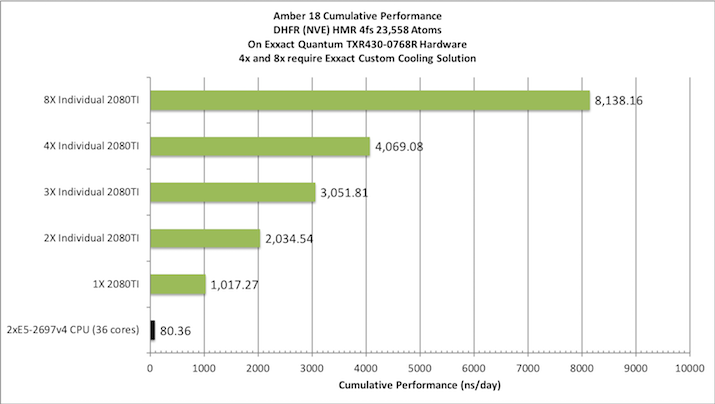
Explicit Solvent PME Benchmarks
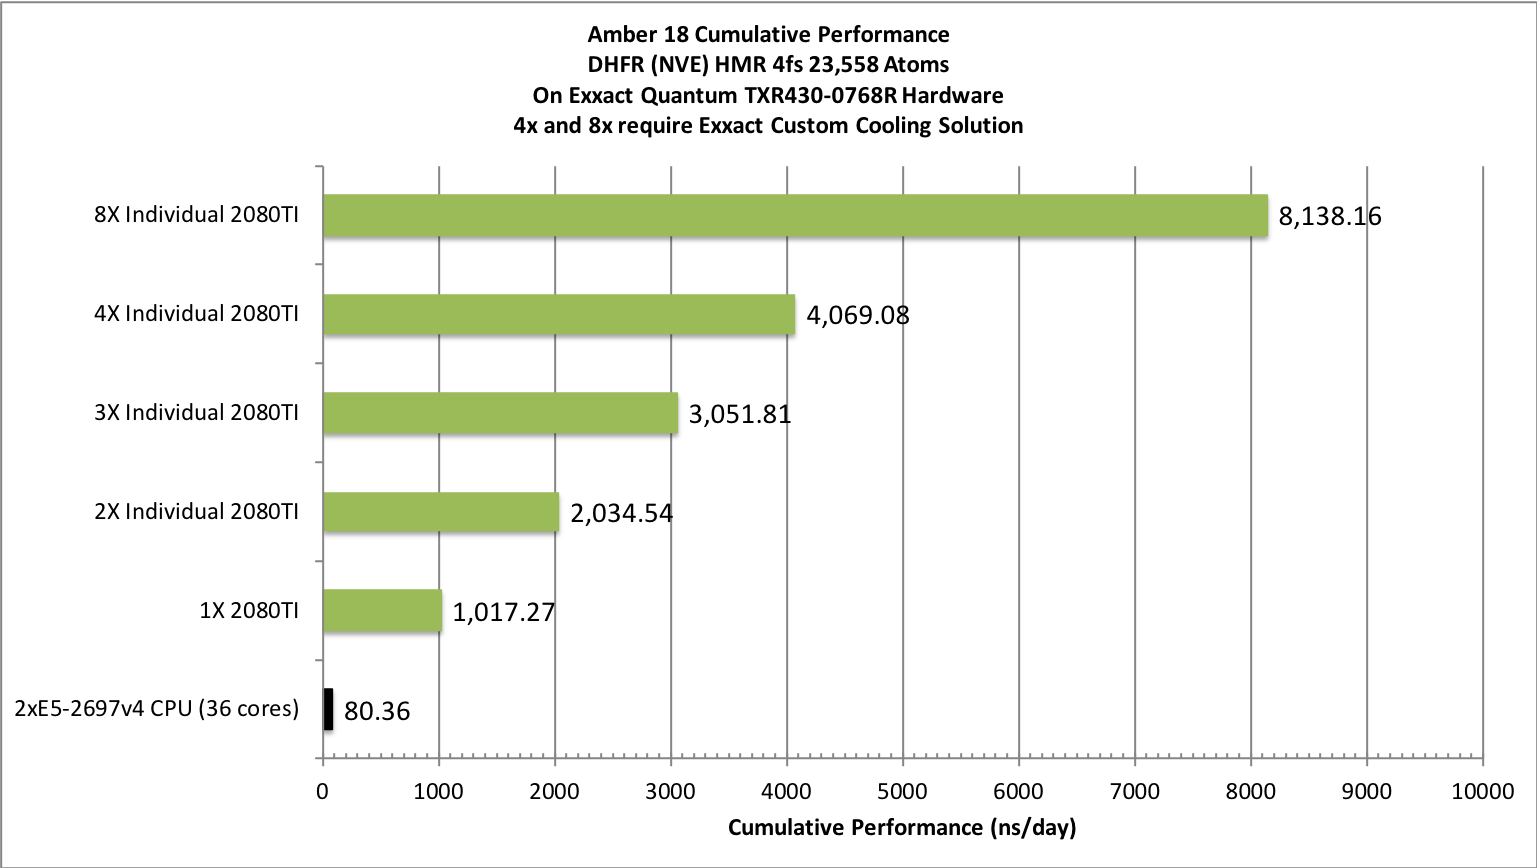
1) DHFR NVE HMR 4fs = 23,558 atoms
Typical Production MD NVE with
  reasonable energy conservation, HMR, 4fs.
  &cntrl
    ntx=5, irest=1,
    ntc=2, ntf=2, tol=0.000001,
    nstlim=75000,
    ntpr=1000, ntwx=1000,
    ntwr=10000,
    dt=0.004, cut=8.,
    ntt=0, ntb=1, ntp=0,
    ioutfm=1,
  &end
  &ewald
    dsum_tol=0.000001,
  &end
Single job throughput
(a single run on one or more GPUs within a single node)
Aggregate throughput (RTX-2080TI)
(individual runs at the same time on the same node)
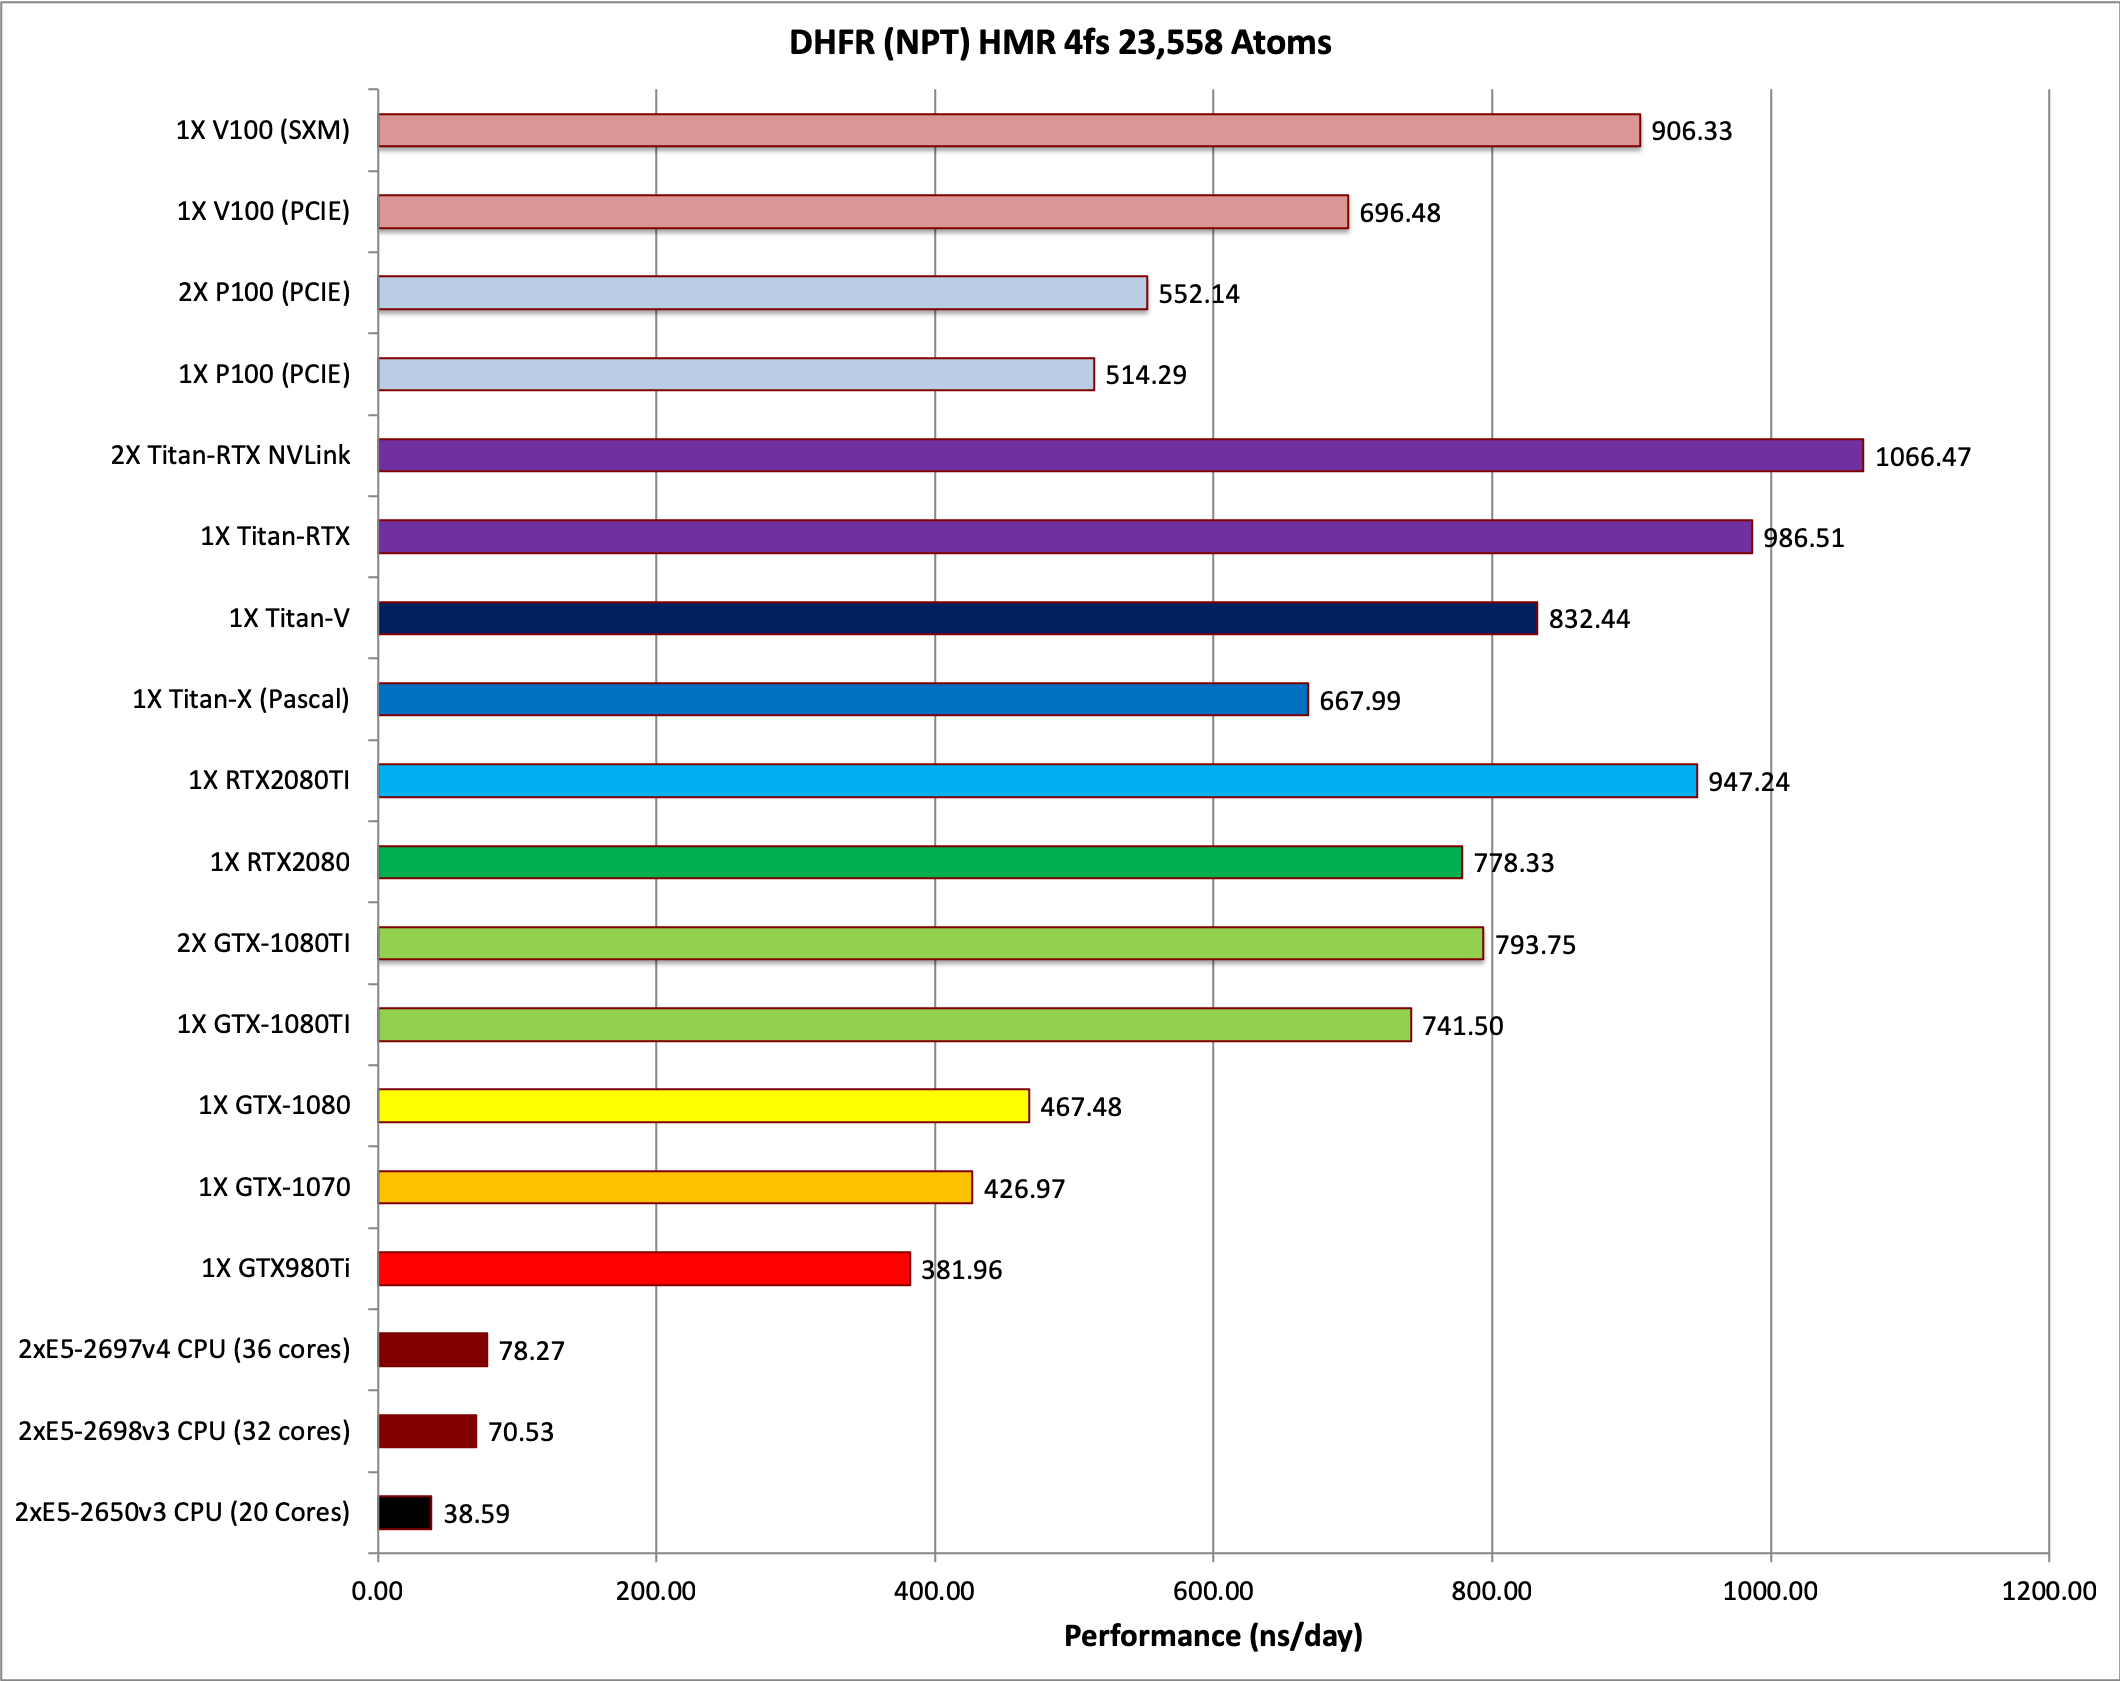
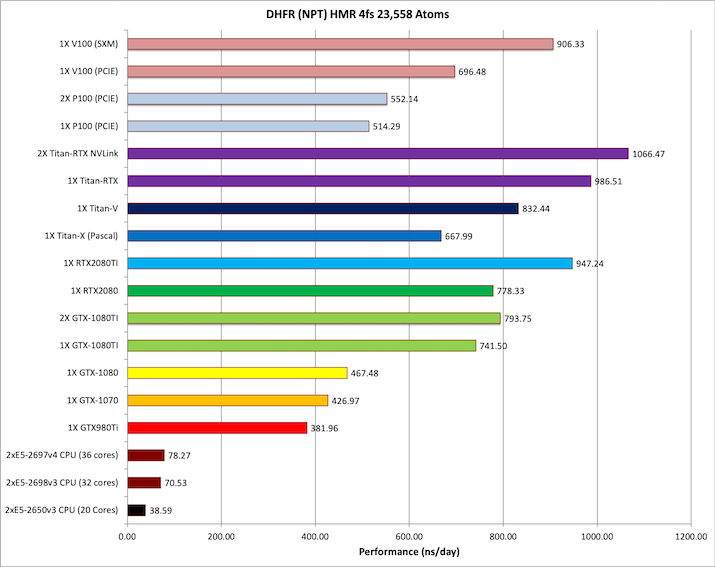
2) DHFR NPT HMR 4fs = 23,558 atoms
Typical Production MD NPT, MC Bar 4fs HMR
  &cntrl
    ntx=5, irest=1,
    ntc=2, ntf=2,
    nstlim=75000,
    ntpr=1000, ntwx=1000,
    ntwr=10000,
    dt=0.004, cut=8.,
    ntt=1, tautp=10.0,
    temp0=300.0,
    ntb=2, ntp=1, barostat=2,
    ioutfm=1,
  &end
Single job throughput
(a single run on one or more GPUs within a single node)
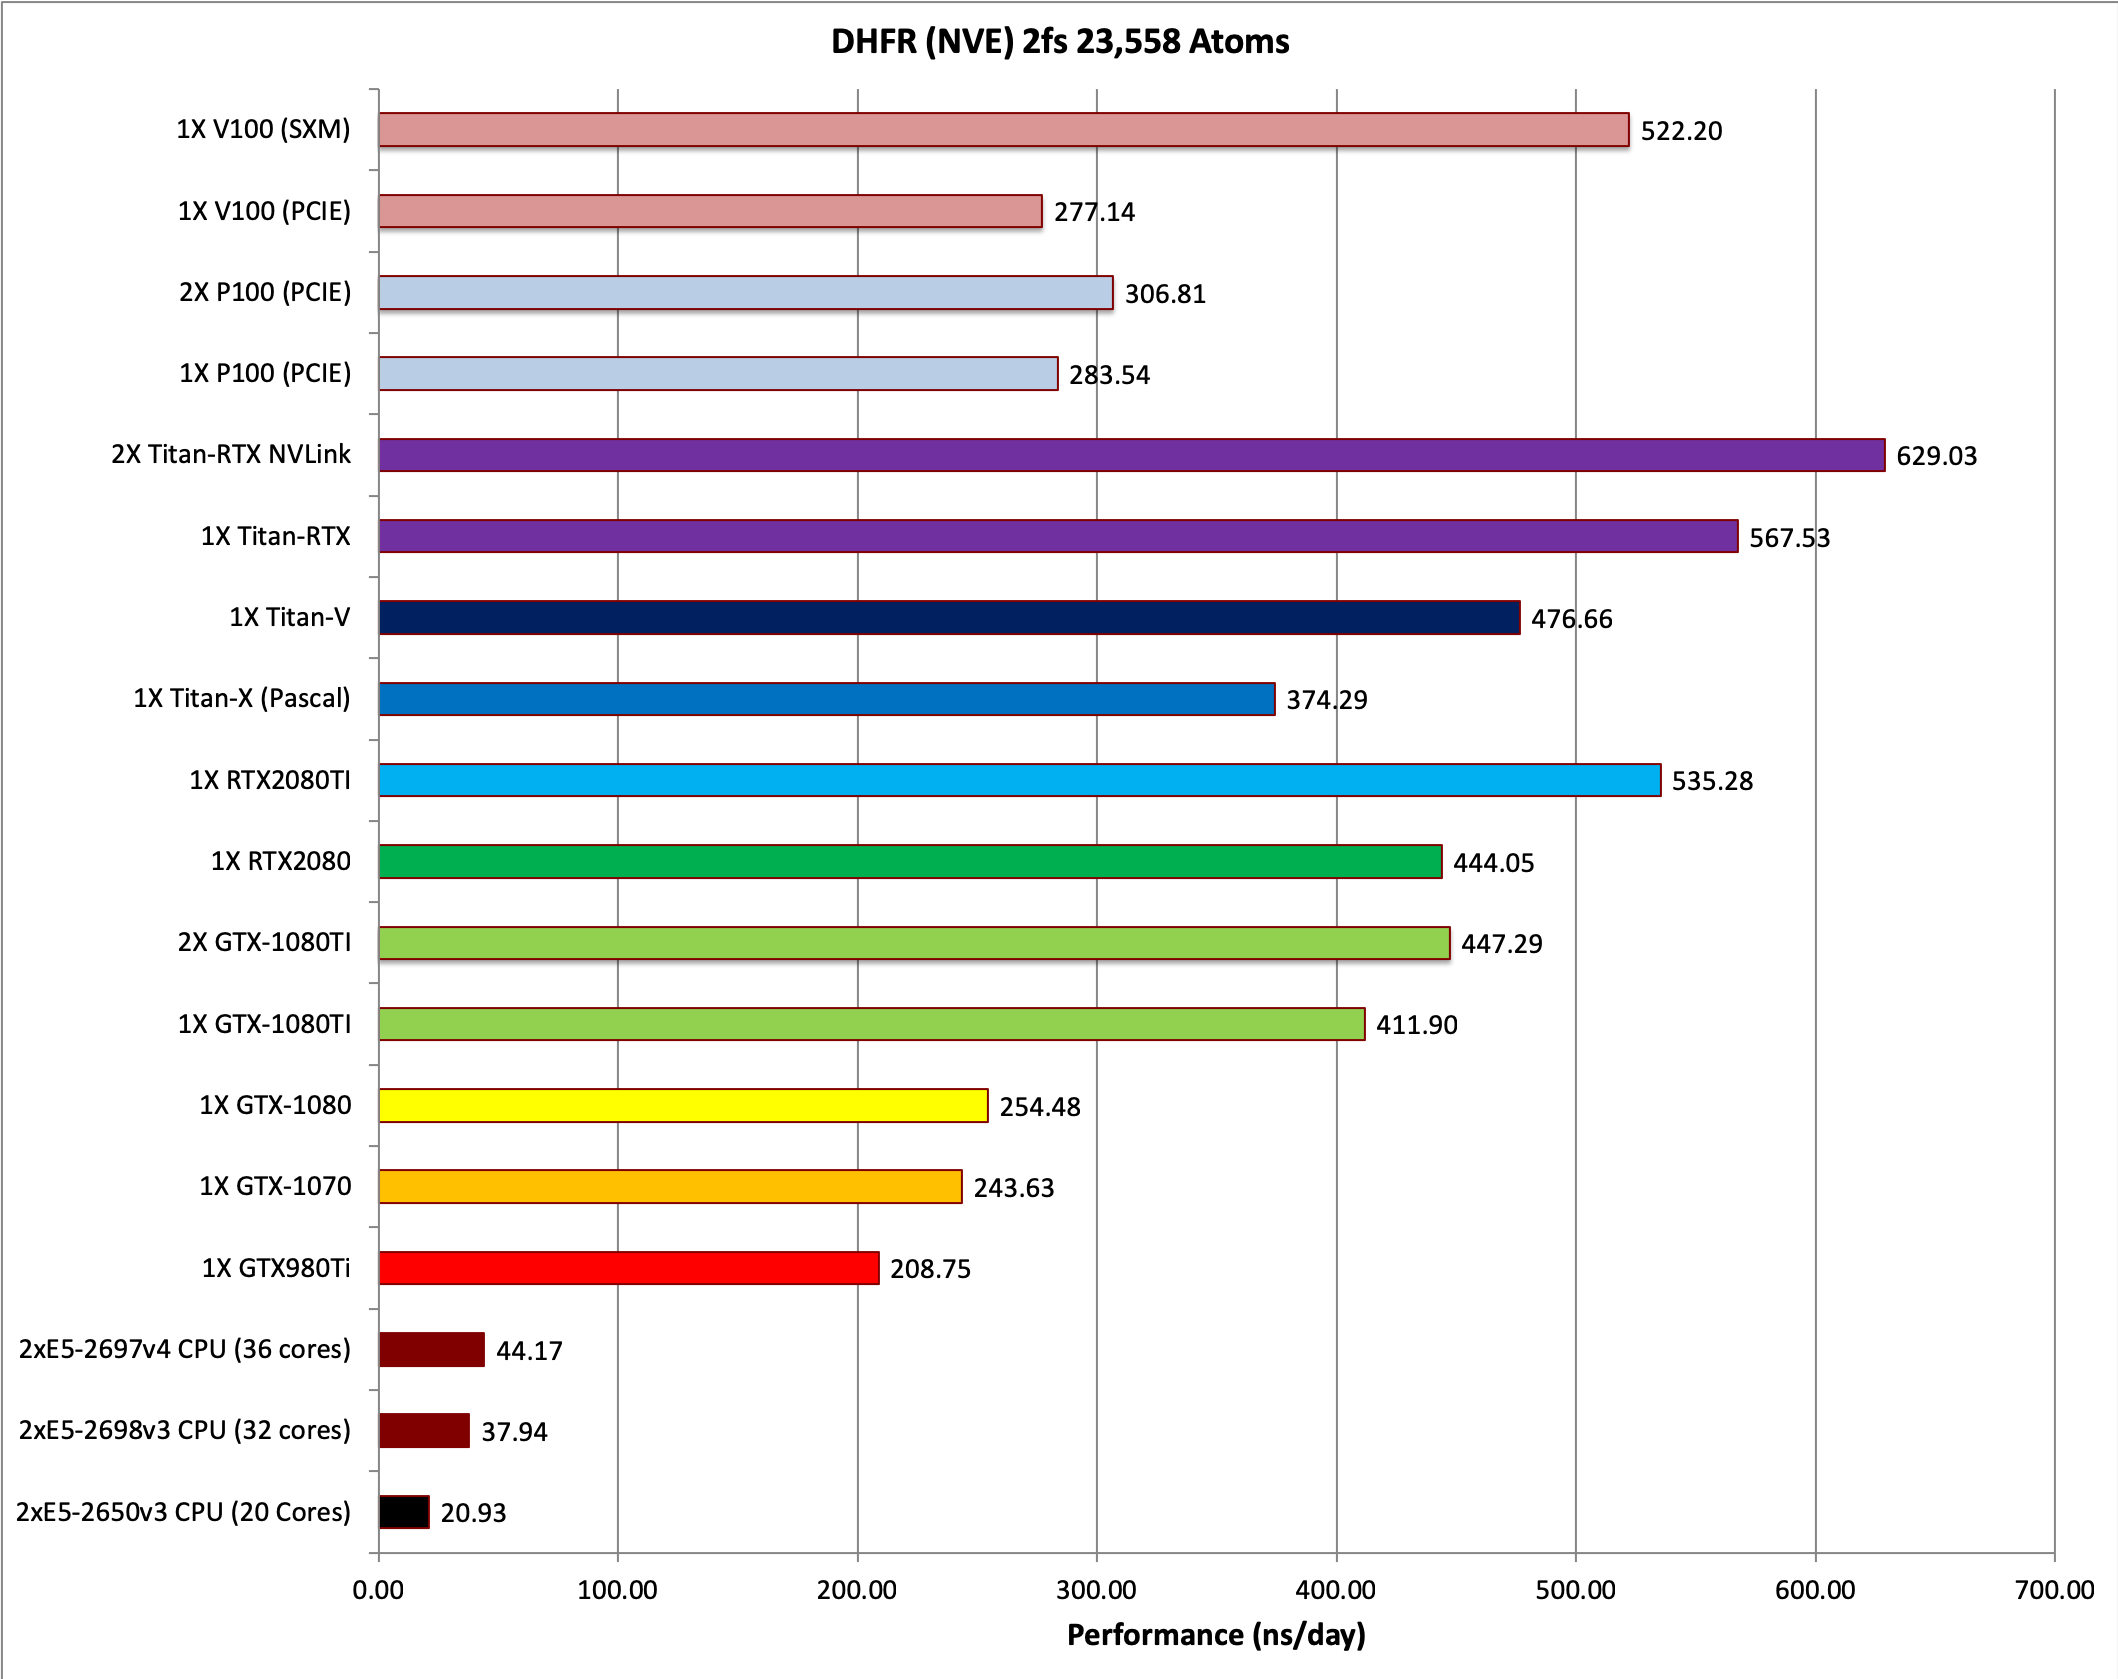
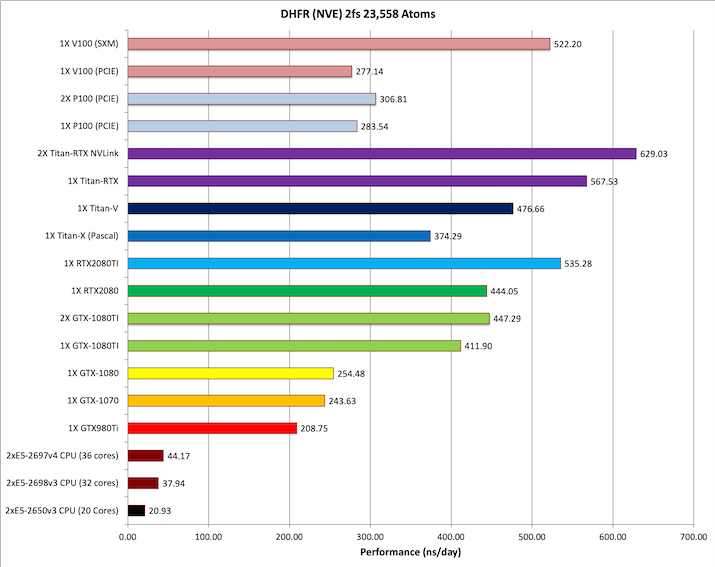
3) DHFR NVE 2fs = 23,558 atoms
 Typical Production MD NVE with
  reasonable energy conservation 2fs.
  &cntrl
    ntx=5, irest=1,
    ntc=2, ntf=2, tol=0.000001,
    nstlim=75000,
    ntpr=1000, ntwx=1000,
    ntwr=10000,
    dt=0.002, cut=8.,
    ntt=0, ntb=1, ntp=0,
    ioutfm=1,
  &end
  &ewald
    dsum_tol=0.000001,
  &end
Single job throughput
(a single run on one or more GPUs within a single node)
4) DHFR NPT 2fs = 23,558 atoms
 Typical Production MD NPT, MC Bar 2fs
  &cntrl
    ntx=5, irest=1,
    ntc=2, ntf=2,
    nstlim=75000,
    ntpr=1000, ntwx=1000,
    ntwr=10000,
    dt=0.00xi24, cut=8.,
    ntt=1, tautp=10.0,
    temp0=300.0,
    ntb=2, ntp=1, barostat=2,
    ioutfm=1,
  &end
Single job throughput
(a single run on one or more GPUs within a single node)

5) Factor IX NVE = 90,906 atoms
 Typical Production MD NVE with
  reasonable energy conservation.
  &cntrl
    ntx=5, irest=1,
    ntc=2, ntf=2, tol=0.000001,
    nstlim=15000,
    ntpr=1000, ntwx=1000,
    ntwr=10000,
    dt=0.002, cut=8.,
    ntt=0, ntb=1, ntp=0,
    ioutfm=1,
  &end
  &ewald
    dsum_tol=0.000001,
    nfft1=128.nfft2=64,nfft3=64,
  &end
Single job throughput
(a single run on one or more GPUs within a single node)
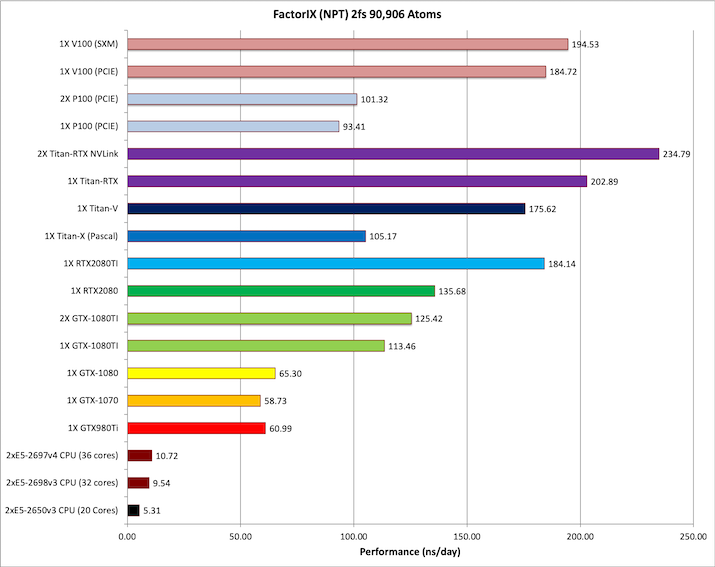
6) Factor IX NPT 2fs = 90,906 atoms
 Typical Production MD NPT, MC Bar 2fs
  &cntrl
    ntx=5, irest=1,
    ntc=2, ntf=2,
    nstlim=15000,
    ntpr=1000, ntwx=1000,
    ntwr=10000,
    dt=0.002, cut=8.,
    ntt=1, tautp=10.0,
    temp0=300.0,
    ntb=2, ntp=1, barostat=2,
    ioutfm=1,
  &end
Single job throughput
(a single run on one or more GPUs within a single node)
7) Cellulose NVE = 408,609 atoms
 Typical Production MD NVE with
  reasonable energy conservation.
  &cntrl
    ntx=5, irest=1,
    ntc=2, ntf=2, tol=0.000001,
    nstlim=10000,
    ntpr=1000, ntwx=1000,
    ntwr=10000,
    dt=0.002, cut=8.,
    ntt=0, ntb=1, ntp=0,
    ioutfm=1,
  &end
  &ewald
    dsum_tol=0.000001,
  &end
Single job throughput
(a single run on one or more GPUs within a single node)
8) Cellulose NPT 2fs = 408,609 atoms
 Typical Production MD NPT, MC Bar 2fs
  &cntrl
    ntx=5, irest=1,
    ntc=2, ntf=2,
    nstlim=10000,
    ntpr=1000, ntwx=1000,
    ntwr=10000,
    dt=0.002, cut=8.,
    ntt=1, tautp=10.0,
    temp0=300.0,
    ntb=2, ntp=1, barostat=2,
    ioutfm=1,
  &end
Single job throughput
(a single run on one or more GPUs within a single node)
9) STMV NPT HMR 4fs = 1,067,095 atoms
 Typical Production MD NPT, MC Bar 4fs HMR
  &cntrl
    ntx=5, irest=1,
    ntc=2, ntf=2,
    nstlim=4000,
    ntpr=1000, ntwx=1000,
    ntwr=4000,
    dt=0.004, cut=8.,
    ntt=1, tautp=10.0,
    temp0=300.0,
    ntb=2, ntp=1, barostat=2,
    ioutfm=1,
  &end
Single job throughput
(a single run on one or more GPUs within a single node)
Implicit Solvent GB Benchmarks
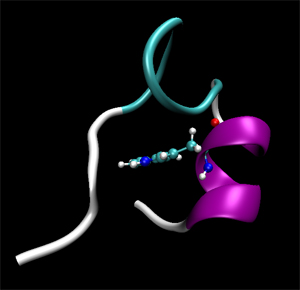
1) TRPCage = 304 atoms
  &cntrl
    imin=0, irest=1, ntx=5,
    nstlim=500000, dt=0.002,
    ntc=2, ntf=2,
    ntt=1, taup=0.5,
    tempi=325.0, temp0=325.0,
    ntpr=1000, ntwx=1000,ntwr=50000,
    ntb=0, igb=1,
    cut=9999., rgbmax=9999.,
  &end
Note: The TRPCage test is too small to make effective use of the very latest GPUs.
Performance on these cards is not as pronounced over early generation cards as it is for
larger GB systems and PME runs. This system is also too small to run effectively over
multiple GPUs.
Single job throughput
(a single run on one or more GPUs within a single node)
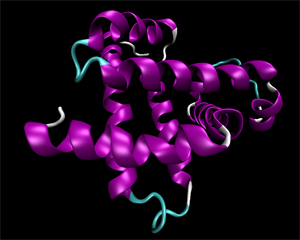
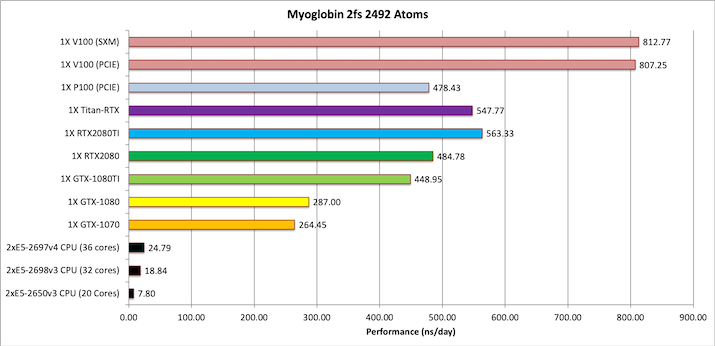
2) Myoglobin = 2,492 atoms
  &cntrl
    imin=0, irest=1, ntx=5,
    nstlim=50000, dt=0.002, ntb=0,
    ntc=2, ntf=2,
    ntpr=1000, ntwx=1000, ntwr=10000,
    cut=9999.0, rgbmax=15.0,
    igb=1, ntt=3, gamma_ln=1.0, nscm=0,
    temp0=300.0, ig=-1,
  &end
Note: This test case is too small to make effective use of multiple GPUs when using the
latest hardware.
Single job throughput
(a single run on one or more GPUs within a single node)
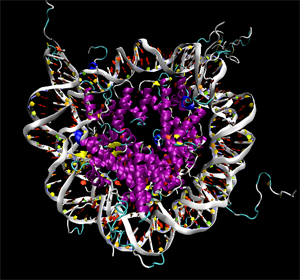
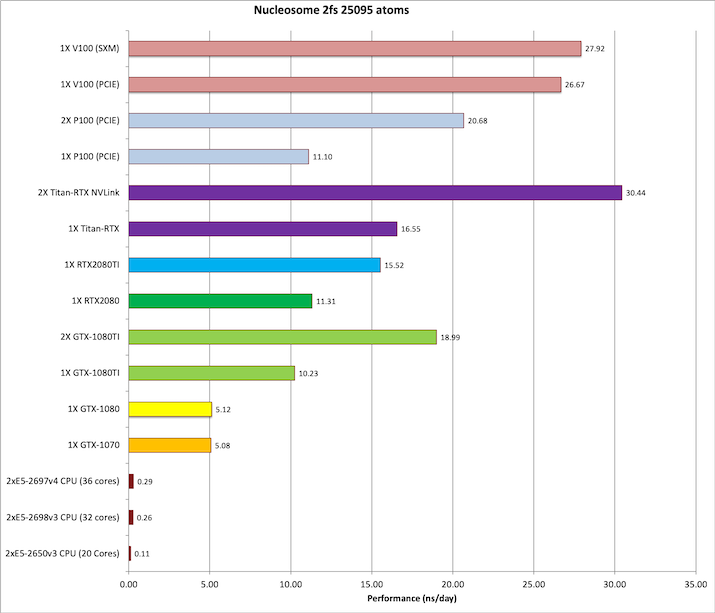
3) Nucleosome = 25,095 atoms
  &cntrl
    imin=0, irest=1, ntx=5,
    nstlim=1000, dt=0.002,
    ntc=2, ntf=2, ntb=0,
    igb=5, cut=9999.0, rgbmax=15.0,
    ntpr=200, ntwx=200, ntwr=1000,
    saltcon=0.1,
    ntt=1, tautp=1.0,
    nscm=0,
  &end
Single job throughput
(a single run on one or more GPUs within a single node)
|